Pisum Genetics
2007—Volume 39
Research Papers
Gene-based markers of pea linkage 
group V for mapping genes related to symbioses
Zhukov, V.A.,1 Kuznetsova, E.V.,1                                         1 All-Russia Res. Inst. for Agri. Microbiol., Saint-Petersburg, Russia
Ovchinnikova, E.S.,1 
                                                               2 Dept. of Plant Sci. and Plant Path.,
Rychagova, T.S.1, Titov, V.S.,1 Pinaev, A.G.,1                          Montana State Univ., Bozeman, MT, U.S.A.
Borisov, A.Y.,1 Moffet, M.,2 Domoney, C.,3                           3 Dept. ofMetabolic Biol., John Innes Centre, Norwich, England
Ellis, T.H.N.,4 Ratet, P.,5 
                                                         4 Dept. of Crop Gen., John Innes Centre, Norwich, England.
Weeden, N.F.2 and Tikhonovich, I.A.1                                   5 Inst. des Sci. du Vegetal, CNRS, Gif sur Yvette, France
Introduction
Genetic mapping, is a useful step in the elucidation and understanding of different biological processes, in
particular, interactions between plants and microbes during beneficial symbioses. To date, several types of
DNA markers, namely RAPD, RFLP, AFLP, SSR, SSAP and gene-specific PCR markers, had been used in pea
(Pisum sativum L.) for creating linkage maps and mapping the genes of important traits (1, 4, 6, 9, 10, 13, 18,
30). Further steps aimed at coding sequence identification refer to positional cloning, which is rather difficult in
pea because of the large size of its genome (8), or candidate gene approach (1), which is now feasible due to
advances in genome sequencing of the legume model species Medicago truncatula Gaertn. (32).
Comparative mapping studies reported a good conservation of marker order between pea and Medicago
sativa
L., a crop species closely related to M. truncatula, for a set of 103 genes (11), and directly between pea and
M. truncatula for a set of 98 genes (1, 5). The conservation of synteny allows us to use the functional mapping
approach in order to clone and sequence pea genes corresponding to phenotypic mutants by taking the
following steps:
1. determine a rough location of the gene of interest on the pea genetic map,
2. define the syntenic region in M. truncatula,
3. identify M. truncatula genes in this region that could be orthologous to pea mutants based on their
biochemical function,
4. create pea markers based on selected M. truncatula genes,
5. analyze recombination between gene-based markers and the mutation in an extended population, and
6. sequence genes that do not demonstrate recombination with mutant phenotype from corresponding
mutant and wild type lines.
In order to exploit the synteny, one has to map pea mutations in relation to gene-based markers and to
compare the resulting map with physical map of M. truncatula. Initially, we concentrated on EST-
derived markers to localize pea genes related to beneficial symbioses.
Materials and methods
Three pea mutant lines induced in the laboratory line SGE (16) were used for gene mapping (Fig. 1). SGEcrt
(curly roots, crt) forms a compact root system when grown in high-density substrate, such as quartz sand (26).
SGEapm (cochleata, or coch) has reduced stipules, abnormal flowers, and sometimes forms roots on the tip of the
nodules (27). SGEFix-- 7 (sym27), defective in nitrogen fixation, forms early senescent, greenish nodules (3).
Segregating populations had been created by crossing mutants SGEcrt, SGEapm and SGEFix-- 7 with lines
NGB1238, RT9 and 87-18 I-r, respectively, and following propagation of the F1. For analysis of mutant trait
segregation, F2 plants were grown in growth chambers (Vb'tsch Industrietechnik VB 1014, Germany) under
controlled conditions (day/night — 16/8 hours, temperature 21 °C, relative air humidity 75%). Seeds of F2
populations were treated with concentrated sulfuric acid for 15 min., washed ten times with distilled water and
19

Pisum Genetics
2007—Volume 39
Research Papers
planted. F2 (SGEcrt x NGB1238)
(Pop1 — 103 individuals) were
grown in quartz sand with full
mineral nutrition added (2) and
analyzed by phenotype (curled root
system) during the 4th week after
planting. F2 (SGEapm x RT9)
(Pop2 — 94 individulas) were grown
in vermiculite with full mineral
nutrition, and formation of stipules
was analyzed on the 7th-10th day
after planting. F2 (SGEFix-- 7 x 87-
18 I-r) (Pop3 — 86 individuals) were
also grown in quartz sand, but with
mineral nutrition lacking NH4NO3
as a source of nitrogen, under
inoculation with Rhizobium
leguminosarum
bv. viciae CIAM1026
(23) immediately after planting.
Four week old plants were scored
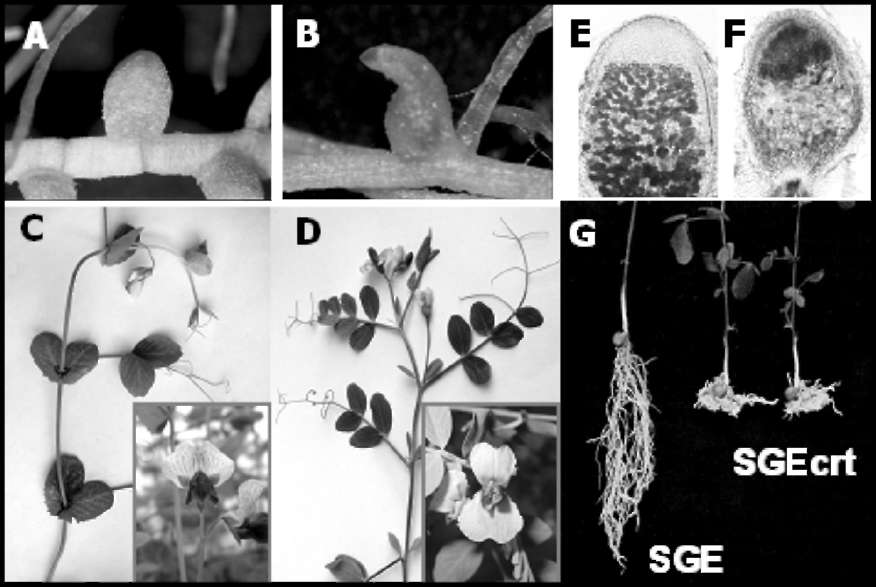
Fig. 1. Phenotypes of crt, coch and sym27 mutants obtained on line SGE.
A - nodule of SGE; B - abnormal nodule of SGEapm (coch); C - shoot and
flower of SGE; D - shoot and flower of SGEapm (coch): reduced stipules
and deformed flower; E - section of nodule of SGE; F - section of early
senescent nodule of SGEFix--7 (sym27); G - root system of SGE and SGEcrt
(crt) grown in quartz sand (25).
for the presence or absence of
functional nodules by observing
their size and color. Because of difficulties in phenotype determination in the F2, the analysis was repeated in
the F3, which also provided information on F2 heterozygotes at the sym27 locus.
DNA was extracted from leaves of F2 plants, as well as of parental lines, by a standard CTAB method (21)
with slight modifications. PCR amplification of DNA markers was performed in thermocyclers Personal Cycler
(Biometra, Germany) and iCycler™ (Bio-Rad, USA). Direct sequencing of PCR products was performed in an
automatic sequencer CEQ™ 8000 Genetic Analysis System (Beckman Coulter, USA). Detected SNPs were
examined for change in recognition sites of endonucleases with use of web-based program dCAPS Finder 2.0.
(20, helix.wustl.edu/dcaps/dcaps.html). Endonucleases for CAPS analysis were supplied by Fermentas
(Lithuania) and SibEnzyme (Novosibirsk, Russia). Fractionation of restriction fragments was performed on
agarose gels (1 — 3%, depending on size of the fragments). Genes for creating EST-markers were chosen by their
location on linkage group V, according to Weeden et al. (30), Brauner et al. (4) and data collected on
http://www.comparative-legumes.org/ (Table 1). Primers had been designed with help from the web-based program
Oligonucleotide Properties Calculator (12, www.basic.northwestern.edu/biotools/oligocalc.html) and
synthesized by Syntol (Moscow, Russia) and Evrogen (Moscow, Russia). Positions of corresponding genes in M.
truncatula
had been detected by CViT-BLAST search on http://www.medicago.org/genome/cvit_blast.php (default
parameters, BLASTN and/or BLASTX), and the presence of homologous gene sequence had been confirmed by
pairwise alignment on NCBI BLAST server (http://www.ncbi.nlm.nih.gov/blast/bl2seq/wblast2.cgi) (24).
Genetic maps for each cross were constructed using the program MapL98 (Prof. Yasuo Ukai, Biometrics
Laboratory, Graduate School of Agricultural Life Science, the University of Tokyo), (default parameters,
LOD > 3.00). Genetic distances between markers were determined by converting the frequency of
recombination events into Kosambi units (15).
Results
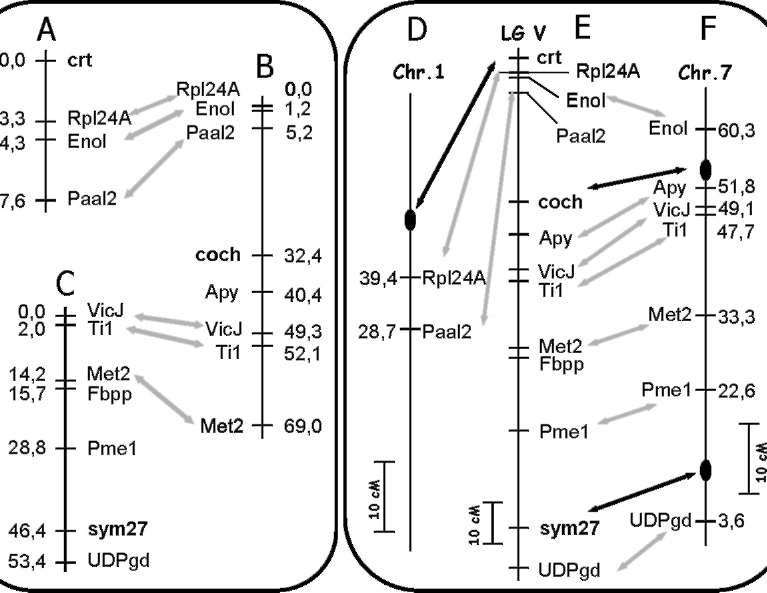
Genes of interest had been previously localized on linkage group V (LG V) of pea: crt in relation to
morphological markers r and tl and the protein marker Sca (26), cochleata in relation to gp and tl (19, 31, cited by
Rozov et al. (22)), and later in relation to the protein markers His1 and Sca (22), and sym27 in relation to
morphological markers gp and Ust (25). Therefore, we have chosen several genes of known position in LG V for
20

Pisum Genetics
2007—Volume 39
Research Papers
the creation of EST-based markers in order to localize genes of interest more precisely. In several cases pea gene
sequences found on NCBI (Table 1) represented only cDNAs, and their exon-intron structure had to be
determined using alignments with corresponding homologs in M. truncatula and Arabidopsis thaliana (L.)
Heynh. In addition to known pea markers, a gene for creating the marker Met2 was detected in BAC mth2-
165g15 of M. truncatula located in the middle of syntenic chromosome 7 of M. truncatula, and the corresponding
sequence of the pea gene was found at NCBI. Also, for primer design for markers Enol and UDPgd conservative
regions of nucleotide sequences of the corresponding genes of A. thaliana and Glycine max (L.) Merr. were used
(17).
Primers were generated on the base of exon sequence to amplify introns as these were considered more likely
to contain SNPs. PCR amplifications were performed on DNA of parental lines, and the resulting PCR products
(approximately 500 — 2000 bp) were directly sequenced and examined for polymorphism. In the case of length
polymorphism (TI1 and Met2 on Pop3) primer pairs were used directly for segregation analysis on F2 DNA, as
well as in the case of allele-specific amplification (Apy on Pop2, VicJ on Pop2 and 3). Otherwise, polymorphic
Table 1. Markers used for mapping in P. sativum.
Marker
Accession
Detection of
name
number
Function assignment
Primers, 5' to 3'
polymorphism
Rpl24A
At-AB199790*
Ribosomal protein L24A
TGC CGA TTC AGT GGT CMA AG
TTC TTS GCT TTC TTC TCA TCC
FspBI (1,2**)
Enol
At-AY150418
Enolase (2-phospho-D-
AGG ATG ACT GGG AGC ACT ATG
Hpa II (1,2)
Gm-AY496909
glycerate hydrolase)
CCA AGC TCC TCC TCA ATT C
Paal2
D10003
Phenylalanine ammonia-
lyase
TGG AAA CAG TAG CAG CAG CC
GGT TTC CCT TGC ATA ACT TCA GC
Hae III (1);
Hindll (2)
Apy
AB088208
Apyrase (ATP
diphosphohydrolase)
GCA ATC ACT TCC TCC CAA T
CAA AAT ACA TCA ATC GCT C
Allele-specific PCR
(2)
VicJ
X67428
Vicilin J
GGC TAA CCG AGA TGA CAA CG
Allele-specific PCR
CTG TGT TGT GGC TCT TGT TCC
(2,3)
TI1
AJ276900
Trypsin/ch ym otrypsin
TCT ACA GAT GTG CAT TTC GTC
AluI (2); length
inhibitor
CAT GAT ACA TAG TTA TAC TTG CT
polymorphism (3)
Met2
AB176565
Metallothionein
AAC TGT GGT TGC GGT ACT AGC
RsaI (2); length
TTA TTC TAT AAC TCC AAA AGG GCG
polymorphism (3)
Fbpp
AF378925
Fructose-1,6-
CCT TAC TCT CCT TCA CGT CT
Eco47I (3)
bisphosphatase
CTT TTC AAC CTT CTC CAC CT
Pmel
AF081457
Pectin methylesterase
GTT CAA AAC TGT GGC TGA
GTG TTC TGG
III GGG TCT TCT C
MnlI (3)
UDPgd
At-NM_123294
UDP-glucose
TGG TGA AGA M! GCT GCA TTG GTG C
HhaI (3)
Gm-U53418
dehydrogenase
TCA TGG ATA GAT CCC TCT GG
* Accession numbers relate to pea genes, except those starting with At and Gm (Arabidopsis thaliana
and Glycine max, respectively)
** Numbers in this column indicate the number of segregating population (Pop1, 2 or 3)
sites had been tested on creation or destruction of recognition site of endonuclease, and the corresponding
enzyme was used to detect allele specificity of PCR products (Table 1).
Recombination analysis detected genetic distances between markers (Table 2), and genetic maps were
constructed for each cross individually (Figs. 2A, B, C). For coch and sym27 gene-based markers flanking genes
21

Pisum Genetics
2007—Volume 39
Research Papers
of interest had been determined, while we were not able to find suitable markers flanking crt from the top of
linkage group V. The segregation of sym27 and several markers segregating in Pop3 appeared to be distorted
Table 2. Segregation data for adjacent markers in all 3 populations studied.
Number of progeny
Linkage
(Haldane cM)
Gene pair
PP
PH
PQ
HP
HH
HQ
QP
QH
QQ
Total
± SE
LOD
Joint x2
P(0.5)
Pop1
crt - Rpl24A
15
2
0
-
-
-
1
57
24
99
3.3 ± 1.9
15.05
48.11
1.12E-08
Rpl24A - Enol
16
0
0
0
58
1
0
1
23
99
1.0 ± 0.7
37.29
154.07
1.07E-30
Enol - Paal2
15
2
0
1
49
3
0
0
21
91
3.3 ± 1.4
28.61
127.31
4.73E-25
Pop2
Rpl24A - Enol
22
0
0
1
43
0
0
1
15
82
1.2 ± 0.9
31.74
143.41
1.91E-28
Enol - Paal2
14
1
0
2
27
2
0
1
9
56
5.5 ± 2.3
15.47
74.14
5.77E-14
Paal2 - coch
11
-
5
7
-
22
0
-
11
56
20.2 ± 5.5
3.80
20.04
2.72E-03
coch - Apy
20
-
4
-
-
-
3
-
64
91
7.9 ± 3.0
12.31
60.72
3.21E-11
Apy - VicJ
19
2
1
-
-
-
4
46
21
93
8.8 ± 3.1
11.46
56.30
2.53E-10
VicJ - TI1
22
1
0
1
46
1
0
2
19
92
2.8 ± 1.2
31.59
146.72
3.82E-29
TI1 - Met2
10
9
0
3
37
5
1
5
12
82
16.3 ± 3.3
9.10
40.34
3.91E-07
Pop1
VicJ* - TI
7
2
0
0
43
1
0
0
24
77
2.0 ± 1.2
27.00
131.42
6.46E-26
TI1** - Pmel
5
2
0
6
34
5
1
12
12
77
20.2 ± 3.9
5.84
24.14
4.92E-04
Pmel - Met2**
5
8
0
0
38
9
0
0
17
77
11.9 ± 2.9
11.96
59.78
4.99E-11
Met2** - Fbpp**
5
0
0
0
38
2
0
0
22
67
1.5 ± 1.1
24.39
118.10
4.08E-23
Fbpp** - sym27*
2
0
0
2
21
4
0
4
14
47
11.4 ± 3.5
8.28
44.28
6.50E-08
sym27* - UDPgd
5
1
0
1
26
2
0
3
15
53
6.9 ± 2.6
12.94
64.36
5.83E-12
* - segregation ratio of marker deviates from 1:2:1
**- segregation ratio of marker deviates from 1:2:1
P - allele of 1st marker, Q - allele of 2nd marker, H
been analyzed as dominant.
(P<0.05)
(P<0.01)
presence of both alleles; "-" indicates that marker had
Fig. 2. Genetic maps of pea linkage
group V and corresponding parts of
genome of M. truncatula (www.
medicago.org/genome)
A - genetic map built on the basis of
Pop1;
B - genetic map built on the basis of
Pop2;
C - genetic map built on the basis of
Pop3;
D - part of chromosome 1 of M.
truncatula;
E - joint map of LG V of pea;
F - part of chromosome 7 of
M.
truncatula.
Black ovals indicate the positions of
presumable orthologs of pea genes of
interest.
22

Pisum Genetics
2007—Volume 39
Research Papers
when compared with a classical 1:2:1 ratio, but linkage between all of them was significant (Table 2).
Genetic maps for all three crosses were compared in order to create a map of pea LG V, corresponding to the
karyotype of SGE line (Figure 2E). Also, comparison of the linkage map of pea LG V with physical maps of
chromosomes 1 and 7 of M. truncatula was performed. M. truncatula BACs containing corresponding homologs
of pea genes used as markers were detected by CViT-BLAST search against pseudochromosomes of M.
truncatula
(available at www.medicago.org/genome), and the genetic positions of identified BACs were used for
creating comparative maps of pea LG V and chromosome 7 and part of chromosome 1 of M. truncatula (Figs.
2D, E, F; 3), on which the positions of probable orthologs of the mutated pea genes were detected.
Table 3. Positions of homologues of pea markers in M.truncatula genome (according to data deposited on
www.medicago.org/genome).
Name of pea
marker
M.truncatula BAC
containing homologue
Accession number of
M. truncatula BAC
Chromosome of
M.truncatula
Position on M.truncatula
genetic map, cM
Rpl24A
mth2-11a6
AC146788
1
39.4
Enol*
mth2-21l10
AC148219
6
60.3
Paal2
mth2-17f11
AC146719
1
28.7
Apy
mtab-58m19
AC145753
7
51.8
VicJ
mth2-36p20
AC148289
7
47.8 - 49.1
TI1
mth2-27l9
AC135311
7
47.7
Met2
mth2-165g15
AC147202
7
33.3
Fbpp
Not known
Not known
Not known
Not known
Pmel
mth2-33b23
AC122166
7
AC122166
UDPgd
mth2-23c14
AC119411
7
AC119411
BAC containing homologue of Enolase is placed in chromosome 6, whereas results of genetic
mapping of Enolase place it in chromosome 7, at the position 60.3 cM from the top.
Discussion
In pea, a long history of genetic mapping with use of morphological and molecular markers resulted in a
genetic map containing positions of numerous mutations (7, 28). In our work we performed the genetic mapping
of three pea mutations in relation to gene-based markers, in order to exploit the synteny of pea and M.
truncatula
genomes for cloning and sequencing the mutated pea genes. Mutants obtained in the line SGE were
crossed with genetically remote lines, expecting to get a high level of polymorphism in segregating populations.
Indeed, the sequences of tested markers were polymorphic, and the most remote line 87-18 I-r exhibited length
polymorphism of TI1 and Met2. Nevertheless, this line appeared to carry the JI1794 allele of
Sym22 leading to formation of a decreased number of nodules, and this made the analysis of symbiotic traits
difficult in this particular case.
The use of several mutants obtained in the same line, SGE, as well as the use of the same markers, let us
combine the results of three independent crosses and calculate the resulting map of LG V. The order of markers
used, as well as the genetic distances between them, is in good agreement with previously published pea maps
(http://www.comparative-legumes.org/). However, the new results on mapping crt are in contradiction with those
described in the article of Kuznetsova et al. (17), even though they are obtained on the same segregating
population. We attribute this discrepancy to the fact that most of the markers used by Kuznetsova et al (17)
were dominant markers, and when we took into consideration additional co-dominant markers (and excluded
dominant morphological markers r and tl), the genetic distances between markers changed noticeably. We
therefore consider these results on crt mapping as an update of the previous ones.
The comparison of relative positions of markers on pea and M. truncatula maps confirmed the high level of
macrosynteny between pea LG V and chromosome 7 of M. truncatula and revealed a small region of synteny
between the top of pea LG V and the middle part of chromosome 1 of M. truncatula. The phenomenon of
23

Pisum Genetics
2007—Volume 39
Research Papers
synteny makes it possible to define the position of probable orthologs of pea genes of interest in the genome of
M. truncatula. Based on localization of cochleata, the position of M. truncatula orthologous gene was calculated
to be around 54.0 cM on the map presented on http://www.medicago.org/. A Tnt1-disrupted gene of M. truncatula with
a similar phenotypic manifestation is localized exactly in this site and, therefore, is probably orthologous to coch
(P. Ratet, unpub.). The positions of orthologs of sym27 and crt, are not detected so accurately, for two reasons.
First, the saturation of the M. truncatula physical map is not high enough throughout, and the regions probably
syntenic to those of crt and sym27 still need to be sequenced properly. Second, the homologs of the markers
Rpl24A and Paal2 (that are close to crt) lie not in chromosome 7 (as the homolog of Enol does), but in
chromosome 1, suggesting the existence of synteny between pea LG V and chromosome 1 of M. truncatula and
making uncertain the position of the orthologue of crt. Therefore, some additional markers need to be designed
based on sequences of M. truncatula genes localized in "syntenic regions", paying particular attention to genes
of transcriptional regulators and membrane proteins as the most probable candidates to be crt and sym27,
respectively.
conclusions
Genetic mapping of pea genes makes possible gene cloning based on homology with known genes of model
objects M. truncatula, A. thaliana and Lotus japonicus (Regel.) Larsen, and the exploitation of syntenic
relationships between legume plants rapidly facilitates the work. To date, eight pea symbiotic genes have been
cloned using this approach (3), and precise mapping of crt, coch and sym27 with the use of cross-species gene-
based markers will draw us near to the cloning and sequencing of these genes. The set of developed gene-based
markers of pea LG V is also planned to be used for mapping the symbiotic pea genes sym16 and sym38,
previously localized in pea LG V (14, 29). In general, functional mapping seems to be a fruitful approach for
cloning pea genes related to symbioses.
Acknowledgments: This work was supported by the grants of RFBR (07-04-01171, 07-04-01558, 07-04-13566, 06-04-
89000-NWOC_a), grant of the President of Russia HIII-9744.2006.4, grant of Russian Ministry of Education and Science
02.512.11.2182, grant of Burgundy Administration (07 9201 AA040 S 3623), NWO grant 047.018.001 and the EU grant
'Grain Legumes' FOOD-CT-2004-506223.
1. Aubert, G., Morin, J., Jacquin, F., Loridon, K., Quillet, M.C., Petit, A., Rameau, C.,
Lejeune-Henaut, I., Huguet, T. and Burstin, J. .2006. .Theor. Appl. Genet. 112: 1024-1041.
2. Borisov, A.Y., Rozov, S.M., Tsyganov, V.E., Morzhina, E.V., Lebsky, V.K. and Tikhonovich, I.A. 1997.
Mol. Gen. Genet. 254: 592-598.
3. Borisov, A.Y., Vasil'chikov, A.G., Voroshilova, V.A., Danilova, T.N., Zhernakov, A.I., Zhukov, V.A.,
Koroleva, T.A., Kuznetsova, E.V., Madsen, L., Mofett, M., Nemankin, T.A., Ovchinnikova, E.S., Pavlova,
Z.B., Petrova, N.E., Pinaev, A.G., Radutoiu, S., Rozov, S.M., Rychagova, T.S., Solovov, I.I., Topunov,
A.F., Weeden, N.F., Tsyganov, V.E., Shtark, O.Y., Stougaard, J., Naumkina, T.S. and Tikhonovich, I.A.
2007. Russian J. Appl. Biochem. Microbiol. ("Prikladnaya biokhimiya I mikrobiologiya") 43: 237-243.
4. Brauner, S., Murphy, R.L., Walling, J.G., Przyborowski, J. and Weeden, N.F. 2002. J. Am. Soc. Hortic.
Sci. 127: 616-622.
5. Choi, H.K., Mun, J.H., Dong-Jin, K., Zhu, H., Baek, J.M., Mudge, J., Roe, B., Ellis, N., Doyle, J., Kiss,
G.B., Young, N.D. and Cook, D.R. 2004. Proc. Nat. Acad. Sci. USA. 101: 15289-15294.
6. Ellis, T.H., Poyser, S.J., Knox, M.R., Vershinin, A.V. and Ambrose, M.J. 1998. Mol. Gen. Genet. 260: 9-
19.
7. Ellis, T.H.N. and Poyser, S.J. 2002. New Phytol. 153: 17-25.
8. Gresshoff, P.M. 2003. Genome Biol. 4: 201.
9. Hall, K.J., Parker, J.S., Ellis, T.H.N., Turner, L., Know, M.R., Hofer, J.M.I., Lu, J., Ferrandiz, C.,
Hunter, P.J., Taylor, J.D. and Baird, K . 1997. Genome 40: 755-769.
10. Irzykowska, L., Wolko, B. and Swiecicki, W. K. 2002. Cell. Mol. Biol. Lett. 7: 417-422.
24

Pisum Genetics
2007—Volume 39
Research Papers
11. Kalo, P., Seres, A., Taylor, S.A., Jakab, J., Kevei, Z., Kereszt, A., Endre, G., Ellis, T.H. and Kiss, G.B.
2004. Mol. Genet. Genomics 272: 235-246.
12. Kibbe, W.A. 2007. Nucleic Acids Res. 35 (Web Server issue): W43-W46.
13. Konovalov, F.A., Toshchakova, E.A. and Gostimsky, S.A. 2005. Cell. Mol. Biol. Lett. 10: 163-171.
14. Koroleva, T.A., Voroshilova, V.A., Tsyganov, V.E., Borisov, A.Y. and Tikhonovich, I.A. 2001. Pisum
Genetics. 33: 30-31.
15. Kosambi, D.D. 1944. Annual Eugenics 12: 172-175.
16. Kosterin, O.E. and Rozov, S.M. 1993. Pisum Genetics 25: 27-31.
17. Kuznetsova, E.V., Tsyganov, V.E., Pinaev, A.G., Moffet, M.D., Borisov, A.Y. and Tikhonovich, I.A. 2005.
Pisum Genetics 37: 42-44.
18. Loridon, K., McPhee, K., Morin, J., Dubreuil, P., Pilet-Nayel, M.L., Aubert, G., Rameau, C., Baranger,
A., Coyne, C., Lejeune-Henaut, I. and Burstin, J. 2005. Theor. Appl. Genet. 111: 1022-1031.
19. Marx, G.A. 1969. Pisum Newslett. 1: 20-21.
20. Neff, M.M., Turk, E. and Kalishman, M. 2002. Trends Genet. 18: 613-615.
21. Rogers, S.O. and Bendich, A.J. 1985. Plant Mol. Biol. 5: 69-76.
22. Rozov, S.M., Temnykh, S.V., Gorel, F.L. and Berdnikov, V.A. 1993. Pisum Genetics 25: 46-51.
23. Safronova, V.I. and Novikova, N.I. 1996. J. Microbiol. Meth. 24: 231-237.
24. Tatusova, T.A. and Madden, T.L. 1999. FEMS Microbiol. Lett. 174: 247-250.
25. Tsyganov, V.E. 1998. PhD Thesis. ARRIAM, St.Petersburg, Russia.
26. Tsyganov, V.E., Pavlova, Z.B., Kravchenko, L.V., Rozov, S.M., Borisov, A.Y., Lutova, L.A. and
Tikhonovich, I.A. 2000. Ann. Bot. 86: 975-981.
27. Voroshilova, V.A., Tsyganov, V.E., Rozov S.M., Priefer, U.B., Borisov, A.Y. and Tikhonovich, I.A. 2003.
In: Tikhonovich, I., Lugtenberg, B. and Provorov, N. (eds.) Biology of Plant-Microbe Interactions, Vol.4.
APS Press, St. Petersburg, Russia-St. Paul, MN, U.S.A., pp 376-379.
28. Weeden, N.F. and Wolko, B. 1990. In: O'Brien, S. J. (ed.) Genetic Maps, 5th Ed., Cold Spring Harbor
Laboratory Press, Cold Spring Harbor, NY, pp 6.106-6.112.
29. Weeden, N.F., Kneen, B.E. and LaRue, T.A. 1990. In: Gresshoff, P.M., Roth, L.E., Stacey, G. and
Newton, W.E. (eds.) Nitrogen Fixation: Achievements and Objectives. Chapman and Hall, New York-
London, pp 323-330.
30. Weeden, N.F., Tonguc, M. and Boone, W.E. 1999. Pisum Genetics 31: 30-31.
31. Wellensiek, S.J. 1962. Genetica (Netherlands) 33: 145-153.
32. Young, N.D., Cannon, S.B., Sato, S., Kim, D., Cook, D.R., Town, C.D., Roe, B.A. and Tabata, S. 2005.
Plant Physiol. 137: 1174-1181.
25