Pisum
Genetics
2007—Volume
39
Research
Papers
154bp), while all of the P.
sativum
ssp. northern humile, ssp. elatius
and ssp. sativum display one or
more strong bands between 154
and 298bp (Fig. 2).
ssp. northern humile, ssp. elatius
and ssp. sativum display one or
more strong bands between 154
and 298bp (Fig. 2).
Because the PSMPA6 STMS
site appeared to segregate with
plant height in ssp. sativum
accessions during the survey
process, the STMS marker is
analyzed further using a set of 57
RILs. The results reveal that the
polymorphic bands do segregate
according to plant height with the
single exception of RIL 46, a short
plant phenotype that produces the
"tall" STMS marker (Fig. 3).
Upon combining the STMS data
with previously gathered
morphological, isozyme, RAPD
and ISSR data, tight genetic
linkage (within 0.9 cM) is
established between the PSMPA6
STMS and morphological marker
Le.
The addition of these
pea
microsatellite-based molecular
markers to current data sets
should be useful for a number of
applications, including both the
microsatellite-based molecular
markers to current data sets
should be useful for a number of
applications, including both the
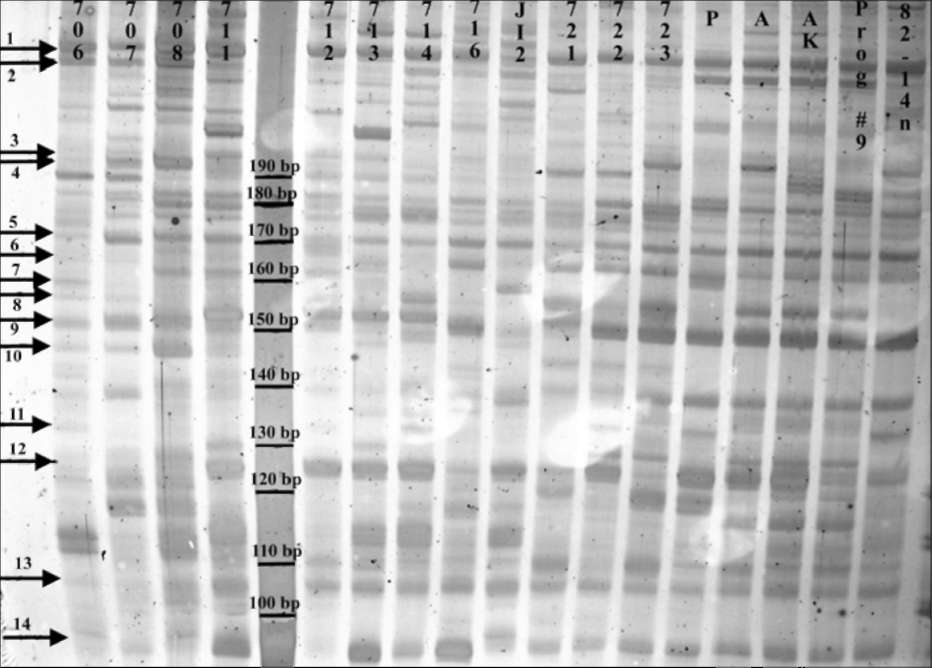
Fig 1. RAMS band patterns
produced using primer set PSMPA7 with pea DNA.
From left to right: fulvum (706, 707 and 708), southern humile (711, 712, 713
and 714), northern humile (716), abyssinicum (JI2), elatius (721, 722 and 723)
and sativum (P=PI179449, A=A1078-234, AK=cv. Alaska, Prog #9= cv. Progress
#9 and 82-14n). JI denotes accessions from the John Innes collection, population
isolates 706-723 are from the Ben Ze'ev and Zohary (1) collection, cv. Alaska is
from J. Mollema and Son, Inc. (Grand Rapids, MI), cv. Progress #9 is from Ferry-
Morse Seeds (Mountain View, CA) and accessions 82-14n, PI179449 and A1078-
234 were kindly provided by G. Marx and N. Weeden. Both monomorphic bands
(1 and 5) and polymorphic bands (2-4 and 6-14) are observed. The marker lane
contains a 10-bp molecular size standard. The 6% polyacrylamide gel is treated
with silver stain and preserved in cellophane. Digital image is captured using a
Nikon CoolPix L5 digital camera mounted above a white light box. Molecular
marker sizes, arrows and accessions are added using Adobe PhotoShop v. 6.0.
delineation of relationships among
cultivated peas and their wild relatives and the development of
highly-
detailed genetic linkage maps.
detailed genetic linkage maps.
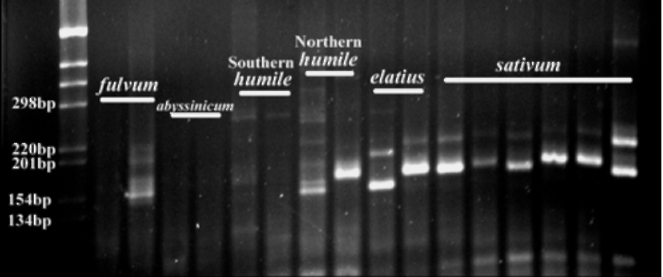
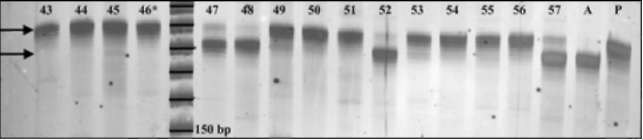
Fig 3. Primer PSMPA6 STMS
band patterns for a
selection of Recombinant Inbred Lines derived from an
initial cross between accessions PI179449 and A1078-
234. Parent PI179449 is a tall plant and displays a
band at ~190bp. Parent A1078-234 is a short plant
and displays a band at ~180bp. RIL individuals 43, 44,
selection of Recombinant Inbred Lines derived from an
initial cross between accessions PI179449 and A1078-
234. Parent PI179449 is a tall plant and displays a
band at ~190bp. Parent A1078-234 is a short plant
and displays a band at ~180bp. RIL individuals 43, 44,
45, 49, 50, 51, 53, 54, 55 and 56 are all
tall
individuals that display the
190bp-"tall" band. RIL
individuals 47, 48, 52 and 57 are all short individuals
that display the 180bp-"short" band. RIL individual #46
is a short plant that displays the "tall" band, thus
suggesting genetic recombination between the STMS
locus and the morphological marker Le. The 6%
polyacrylamide gel is treated with silver stain and
preserved in cellophane. Digital image is captured
using a Nikon CoolPix L5 digital camera mounted
above a white light box. Molecular marker sizes,
arrows and accessions are added using Adobe
PhotoShop v. 6.0.
Fig 2. Primer PSMPA6 STMS
band patterns detected in
pea DNA. From left to right: fulvum (703 and 707),
abyssinicum (JI2 and JI225), southern humile (713 and
714), northern humile (716 and JI1794), elatius (721 and
722) and sativum (JI228, JI264, JI787, JI1035, JI1372
pea DNA. From left to right: fulvum (703 and 707),
abyssinicum (JI2 and JI225), southern humile (713 and
714), northern humile (716 and JI1794), elatius (721 and
722) and sativum (JI228, JI264, JI787, JI1035, JI1372
and cv. Alaska). JI denotes
accessions from the John
Innes collection, population isolates 703-722 are from
the Ben Ze'ev and Zohary (1) collection and cv. Alaska is
from J. Mollema and Son, Inc. (Grand Rapids, MI). PCR
products are run on a 3% agarose gel and stained with
ethidium bromide. The digital image is captured using a
Gel Logic 200 Imaging System with UV transillumination.
Molecular marker sizes,
arrows and accessions are 11
added using Adobe PhotoShop v. 6.0.
added using Adobe PhotoShop v. 6.0.