Pisum Genetics
2006—Volume 38
Research Papers
Two Argonaute1 genes from pea
DeMason, D.A. and                                                        Bot. and Plant Sci., Univ. of California, Riverside, CA, USA
Weeden, N.F.                                                 Plant Sci. and Plant Path., Montana State Univ., Bozeman, MT, USA
Introduction
The Argonaute/PIWI family of proteins was founded by the Argonaute genes in Arabidopsis and PIWI in Drosophila. These proteins have now been found in many species of plants, invertebrates and vertebrates, including humans. These proteins are known to function in RNA silencing and contain two conserved domains known as PAZ and PIWI (4). The AGO protein is a component of the RNA-induced silencing complex (RISC), which targets specific mRNAs for destruction using a microRNA (miRNA) as a guide. Recent 3-D analysis of the PAZ and PIWI domains has provided data to explain their functions. The PAZ domain binds to nucleic acids, with a preference for RNA over DNA (18). The 3-D structure of the PIWI domain is similar to that of the RNase H family of enzymes, and it is thought to function as the catalytic site for target mRNA cleavage (15).
There are 10 members of the Argonaute gene family in Arabidopsis. Some of these genes are known to play roles in development because mutants have dramatic developmental phenotypes. AGO7/ZIPPY controls early shoot ontogeny, and AGO10/PINHEAD/ZWILLE plays several roles in shoot meristem identity and maintenance (8, 11, 12, 14). Mutants of AGO1 show many developmental defects. Vegetative leaves often lack blades, axillary buds are lacking, cauline leaves are filamentous, abnormal inflorescences produce sterile, radial flowers, the stem is fasciated, and plants show defects in auxin responses (3, 10, 16, 19). AGO1 is unusual among Arabidopsis AGO family members in that it possesses a miRNA target site and is apparently regulated itself by miR168 (22).
Our goal was to identify AGO1-like genes from pea, compare their sequences to AtAGO1 and other AGO1-like genes, map them to determine if any known mutants in pea correspond to these genes, and observe expression patterns in parts of pea plants, including shoot tips of the leaf form mutants.
Materials and Methods
Pisum sativum genotypes used for this study were obtained from the Marx collection. The tendrilled acacia (uni-tac) line was W6 15272. The other lines used were from a set of near isogenic lines constructed by G.A. Marx and designated: wildtype (WT) W6 22593, acacia/tendril-less (tl) W6 22594, afila (af) W6 22597, and the double mutant, af tl W6 22598. Plants were grown in a standard greenhouse at 20°C in the day and 15°C at night.
To obtain gene sequences, a WT shoot tip cDNA library was screened as described previously (7) using the AtAGO1 PIWI box sequence as a probe. Positive clones were then sequenced and primers were designed to do both 5’ and 3’ RACE to obtain the full coding sequences (5). Sequence analysis was done using the NCBI website (http://www.ncbi.nlm.gov/) and the MultAlin program (http://prodes.toulouse.inra.fr/multalin.html). The putative miRNA binding sites were identified using the Microinspector website (http://www.imbb.forth.gr/microinspector) (17).
To obtain data on gene-specific expression, plant parts, embryos and shoot tips were obtained, cDNAs prepared and PCR was done in the linear range as described previously (1, 6). Expression was calculated on the basis of control genes, which were DEAD-box or fi-actin and PCR was done as described previously (6). The primers for PsAGO1 were F: GCT CTT GGT TGC TTA GGT GA and R: TGC TGT GGA GTA AAA CAT CTC A and for PsAGO2 were F: ATT CCC ACG CAT TAC ACA C and R: CTC GAC AAT TTT GCA GAC C. The PCR products obtained from cDNAs were 1425 bp and 800 bp, respectively.
Mapping of AGO sequences was performed on two recombinant inbred (RI) populations derived from the crosses JI 1794 x ‘Slow’ and MN313 x JI 1794. The former population consisted of 53 F12 lines, and segregation data for over 1000 markers is available for this population (23 and unpublished). The latter population consisted of 50 F8 lines, and about 300 markers have been mapped on the linkage map developed for this
3
Pisum Genetics
2006—Volume 38
Research Papers
population. Primers used for mapping the PsAGO1 sequence were F: GGC GGT GTG GGC CCT GGT and R: GAG CCA AGG CGC AGG AAG. These primers were selected to span introns in the genomic sequence. Primers for mapping the PsAGO2 gene were F: TGC ATT TAT TGA GCC ACT GC and R: TGC AAG CTC ACA ACA AAA GG. These primers were expected to amplify a 1927 bp region across intron 2. Polymorphism was identified by CAPS analysis (9).
Relationships among the various Argonaute sequences available in the literature were determined using Phylogenic Analysis Using Parsimony (PAUP) version 4.0b10 (20). The sequences compared are listed in Table 1. Complete coding sequences were used for the comparison among the two pea sequences, the AtZWILLE, AtPINHEAD and AtAGO1 sequences from Arabidopsis thaliana, the four sequences from Oryza sativa and the two sequences from Nicotiana bethamiana. Only partial coding sequences (ESTs) were available for the Trifolium pratense, Medicago truncatula, Phaseolus coccineus and Arachis hypogaea genes, and these were compared with the two Pisum sativum sequences and the AtAGO1 and NbAGO1-1 sequences using only approximately 660 bp near the 3’ end of the coding sequence available from each of the EST sequences. For this latter analysis the AtAGO1 and NbAGO1-1 sequences were used as the outgroup.
Table 1. List of Argonaute sequences used in the PAUP analysis
Sequence designation
Source
NCBI accession
PsAGO1
Pisum sativum
EF108450
PsAGO2
Pisum sativum
EF108449
T. pratense
Trifolium pratense
AB236789
M. truncatula
Medicago truncatula combined
CB895213 and BM779610
P. cocinneus
Phaseolus coccineus
CA905209
A. hypogaea
Arachis hypogaea
EG029779
AtAGO1
Arabidopsis thaliana
U91995
NbAGO1-1
Nicotiana bethamiana
DQ321488
NbAGO1-2
Nicotiana bethamiana
DQ321489
OsAGO1
Oryza sativa
NM_001054239
OsAGO4g566500
Oryza sativa
NM_001060116
OsAGOJO13091
Oryza sativa
AK111587
OsAGO2g831600
Oryza sativa
NM_0010551 56
AtPINHEAD
Arabidopsis thaliana
AF154272
AtZWILLE
Arabidopsis thaliana
NM123748.2
Results and Discussion Results and Discussion
Complete coding sequences of two pea AGO genes were obtained with our methods. We call these PsAGO1 (EF108450) and PsAGO2 (EF108449). Based on the predicted amino acid sequences, these proteins were of similar lengths (1100 vs 1070 aa). They contained the two domains common to Argonaute genes: PAZ (aa 438 and 436 respectively) and PIWI (aa 726 and 696 respectively). BLAST comparisons of these amino acid sequences with other known AGO proteins revealed that they were most similar to AGO1 (NP_849784) in Arabidopsis, two AGO1-like sequences from Nicotiana benthamiana (ABC61502 and ABC61503) and a putative Argonaute protein from rice (BAD27856). These proteins showed strong sequence conservation in all regions except the N-terminal region, which had considerable gene specific variation (data not shown).
Comparison of the two Pisum sativum DNA sequences with other complete coding sequences (Fig 1A) revealed that the two clearly clustered with other AGO1 sequences and were clearly distinct from ZWILLE
4
Pisum Genetics
2006—Volume 38
Research Papers
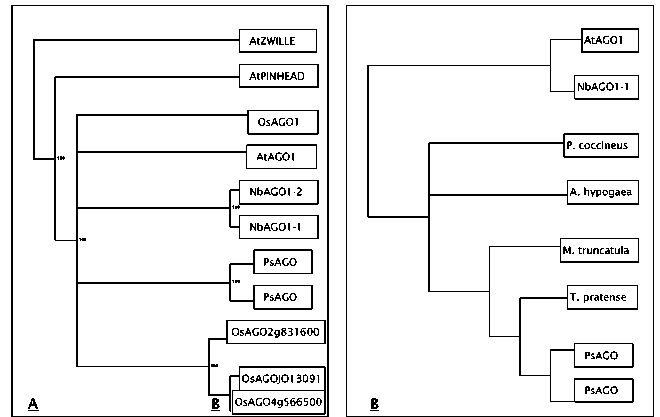
Fig. 1. Phylogenetic relationships among the Argonaute sequences based on PAUP analysis. A) The strict con­sensus tree for the full-length plant Argonaute genes available in the literature and B) the strict consensus tree for the comparison of approximately 600 bp of coding sequence at the 3’ end of an AGO gene from each of the legume species listed. The Arabidopsis and Nicotiana sequences were used as outgroups for the latter analysis.
and PINHEAD sequences. The Pisum sequences were most closely related to each other, with the AtAGO1 sequence being the next most similar, confirming the results from the protein sequence analysis. Although two AGO1 genes are also found in Nicotiana benthamiana, the presumed duplication producing those two sequences apparently occurred independently of the duplication forming the two Pisum sequences. PAUP analysis of the partial coding sequences available from other legume species produced a tree that mirrored the established phylogeny of the taxa being compared (Fig. 1B). Two most parsimonious trees were detected. Only the strict consensus tree is shown in Fig. 1B. These results support the hypothesis that only AGO1 members of the Argonaute gene family are being compared in this analysis.
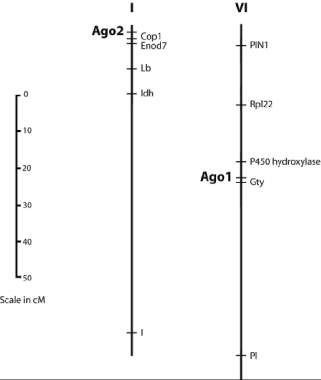
The PsAGO1 primers amplified a product of approximately 1500 bp that displayed polymorphism between JI 1794 and the domesticated lines when cut with the restriction enzyme HaeIII . The position of the locus Ago1 was determined to be on linkage group (LG) VI about 4 cM from Gty (Table 2). In the JI 1794 x ‘Slow’ linkage map, the region around Gty appeared to be compressed, with 10 or more markers within 5 cM of Gty. The order of the markers was ambiguous, and it could not be determined on which side of Gty Ago1 was located. The data from the second RI population indicated Ago1 lay distal to Gty, towards Rpl22 (Fig. 2).
The PsAGO2 primers amplified a fragment of about 2000 bp in the domesticated lines but did not amplify a product in JI 1794. This presence/absence polymorphism could be easily scored without need for CAPS analysis. Ago2 was found to be the most distal marker on the upper arm of LGI in both RI populations (Fig 2). The combined data from both populations placed Ago2 approximately 3 cM from Cop1 (Table 2).
5
Pisum Genetics
2006—Volume 38
Research Papers
Neither the position of Ago1 nor Ago2 obviously matched that of known mutations in pea that modify leaf development. There is no known morphological mutation in pea that maps near Cop1 (23). Several mutations are located within 15 cM of Gty, including rui, p, and er1. Of these, only rui has a phenotype that might be expected from a mutation in an Argonaute gene (21, 24). Neither the roughened testa characteristic of Gty nor the loss of sclerenchyma in the pod walls displayed by plants homozygous for p are expected phenotypes for a mutation at Ago1. Nor would a mutation of this gene be expected to confer resistance to powdery mildew. Hence, we are investigating only the possibility of a relationship between rui and Ago1. At present the relative position of Rui to Gty is uncertain. Four amino acids (Y, K, Q and K) present near the 5’ end of the conserved PIWI domain have been shown to be important for RNA binding affinity of the Archeoglobus fulgidus Piwi protein and three of these (K, Q, K) have also
been shown to be important in cleavage of the target mRNA by the human AGO2 protein (13). These amino acids are also conserved in PsAGO1 and PsAGO2, as well as in the other
Fig. 2. Location of Ago1 and Ago2 on pea linkage groups VI and I, respectively. The scale on the left gives approximate recombination distances for both linkage groups.
AGO1-like proteins from the other plant
species we examined (Fig.3A). Conservation of these four amino acids extends to the Arabidopsis AGO10/PNH/ZLL protein. Because of this conservation, it is likely that all of these proteins are active in RNAi regulation of gene expression. AtAGO1 mRNA is known to be regulated by a miRNA (miR168), the Microinspector program was used to evaluate the pea nucleotide sequences for potential miRNA binding sites using sequences of Arabidopsis thaliana miRNAs and -27 as the free energy (AG) limit for both PsAGO1 and PsAGO2. Both pea sequences possessed a potential miR168 binding site in approximately the same position as the one identified in AtAGO1 (Fig. 3B). In fact, the target sequences from pea are better matches to the Arabidopsis miR168 sequence than the target in AtAGO1 (AG of -34.7 vs. -21). The two AGO1 genes from
Table 2. Joint segregation analysis of PsAGO genes and closely linked standard markers
No. of lines with designated genotype1
Recombination
RI population
N
P1 P1
P1P2
P2P1
P2P2
Fraction + SE
Ago1/Gty
JI 1794 x ‘Slow’
43
22
1
1
29
3 + 1
MN313 x JI
46
24
5
0
17
5 + 1
Ago2/Cop1
JI 1794 x ‘Slow’
49
14
4
2
29
6 + 1
MN313 x JI 1794
48
22
0
1
25
5 + 1
1Genotype designations: P1 = Maternal parent, P2 = Paternal parent. All genotypes were homozygous.
6
Pisum Genetics
2006—Volume 38
Research Papers
Fig. 3. Sequence comparisons. A. Alignment of predicted PsAGO1 and PsAGO2 amino acid sequences with some similar plant AGO1-like genes. B. Nucleotide sequences of PsAGO1 and PsAGO2 and match-up with that of Arabidopsis miR168.
tobacco and the putative Argonaute sequence from rice lack this target site (data not shown). From these data we would predict that PsAGO1 and PsAGO2 are both regulated by a single miRNA.
Both PsAGO1 and PsAGO2 were expressed in all growing plant parts and showed very similar expression patterns (Fig 4A). mRNA levels of both genes were abundant in developing and mature embryos as well (Fig. 4B). mRNA levels of PsAGO1 appeared to be more abundant in young embryos and the embryonic axis of mature embryos than PsAGO2. Bohmert et al. (3) found that AtAGO1 was expressed in all plant parts and at all stages of development in Arabidopsis. The two pea genes have overlapping and redundant expression patterns in all part of pea tested.
As AtAGO1 was originally described as a leaf development gene, we looked at mRNA level of PsAGO1 and PsAGO2 in the shoot tips of the leaf form mutants. mRNA levels of both genes were higher in the af genotypes (af and af tl) than in WT (Fig. 5). The mRNA levels of PsAGO1 were similar in tl, uni-tac and WT, whereas those of PsAGO2 were lower in the tl and uni-tac genotypes than in WT. This pattern of differential expression was not what we had expected from the phenotype of AGO1 mutants in Arabidopsis, which have peg-shaped leaves lacking a lamina. The radial symmetry of peg-shaped leaves and of tendrils suggested that mRNA levels of these genes might be lower in af and higher in tl and uni-tac. Instead, the pattern of mRNA expression of these
7
Pisum Genetics
2006—Volume 38
Research Papers
Figure 5. PsAGO1 and PsAGO2 expression shoot tips. Expression is expressed relative to mRNA of actin which was used for equal cDNA for RT-PCR and equal loading.
Fig. 4. PsAGO1 and PsAGO2 expression. A. Expression in various plant parts. B. Expression in different stages of developing embryos. DEAD-box was used as a control for equal cDNA used for RT-PCR and equal loading.
two genes is similar to that of Uni, PsPIN1 and PsPK2, which are all GA and auxin regulated (1, 2, 6), suggesting that these two genes play a role in auxin signaling. Sorin, et al. (19) have shown that in Arabidopsis AGO1 plays a role in two auxin responses: auxin-mediated hypocotyle elongation and adventitious root formation.
In conclusion, we have identified two pea genes similar in sequence to AtAGO1 which we call PsAGO1 and PsAGO2. They map to LGVI near Gty and on the upper arm of LGI near Cop1, respectively. The position of theAgo1 locus in pea encourages further examination of its relationship to the mutant ruinous. Sequence analysis suggests that both PsAGO1 and PsAGO2 function in RNAi and are themselves regulated by a miRNA, just as AtAGO1 is. These genes have overlapping and redundant expression patterns in developing pea and are differentially expressed in shoot tips of the classic pea leaf mutants.
Acknowledgements: The authors thank Matt Lavin for assistance with the PAUP analysis and Janet Giles for her technical support.
1.  Bai, F. and DeMason, D.A. 2006. Plant Cell Physiol. 47: 935-948.
2. Bai, F., Watson, J.C., Walling, J., Weeden, N., Santner, A.A. and DeMason, D.A. 2005. Plant Sci. 168: 1281-1291.
3. Bohmert, K., Camus, I., Bellini, C., Bouchez, D., Caboche, M. and Benning, C. 1998. EMBO J. 17: 170-180.
4. Cerutti, L., Mian, N. and Bateman, A. 2000. Trends Biochem. Sci. 25: 481-482.
5. Chawla, R. and DeMason, D. 2003. Pisum Genet. 35: 3-5.
6. Chawla, R. and DeMason, D.A. 2004. Plant Growth Reg. 44: 1-14.
7. Giles, J.E., Villani, P.J. and DeMason, D.A. 1998. Plant Physiol. 117: 1125.
8. Hunter, C., Sun, H. and Poethig, R.S. 2003. Curr. Biol. 13: 1734-1749.
8
Pisum Genetics
2006—Volume 38
Research Papers
9. Jarvis, P., Lister, C, Szabo, V., Dean, C, Konieczny A. and Ausubel, F.M. 1994. Plant Mol. Biol. 24: 685-687.
10.  Kidner, C.A. and Martienssen, R.A. 2004. Nature 428: 81-84.
11.   Lynn, K., Fernandez, A., Aida, M., Sedbrook, J., Tasaka, M., Masson, P. and Barton, M.K. 1999. Development 126: 469-491.
12.  McConnell, J.R. and Barton, M.K. 1995. Dev. Genet. 16: 358-366.
13.   Ma, J-B., Yuan, Y-R., Meister, G., Pei, Y., Tuschl, T. and Patel, D.J. 2005. Nature 434: 666-670.
14.  Moussian, B., Schoof, H., Haecker, A., Jürgens, G.. and Laux, T. 1998. EMBO J. 17: 1799-1809.
15.  Parker, J.S., Roe, S.M., and Barford, D. 2004. EMBO J. 23: 4727-4737.
16.  Ronemus, M., Vaugh, M.W.and Martienssen, R.A.. 2006. Plant Cell 81: 1559-1574.
17.   Rusinov, V., Baev, V., Minkov, I. and Tabler, M. 2005. Nuc. Acid Res. 33: W696-W700.
18.  Song, J.-J. and J.-T. Leemor. 2006. Cur. Opin. Structural Biol. 16:5-11.
19.  Sorin, C, Bussell, J.D., Camus, I., Ljung, K., Kowalczyk, M., Geiss,G., McKhann, H., Garcion, C, Vaucheret, H., Sandberg, G. and Bellini, C. 2005. Plant Cell 17: 1343-1359.
20.  Swofford, D. 1998. PAUP*: phylogenetic analysis using parsimony (*and other methods), Version 4.0b10a. Sinauer Associates, Sunderland, MA, USA.
21.  Swifcicki, W.K. 1988. Pisum Genetics 20: 38.
22.  Vaucheret, H., Vazques, F., Crété, P, and Bartel, D.P. 2004. Genes and Dev. 18: 1187-1197.
23.  Weeden, N.F., Ellis, T.H.N., Timmerman-Vaughan, G.M., Swifcicki, W.K., Rozov, S.M. and Berdnikov, V.A. 1998. Pisum Genetics 30: 1-4.
24. Wolko B. 1989. Pisum Genetics 21: 80-81.
9