Pisum Genetics
2006—Volume 38
Research Papers
Development and characterization of microsatellite loci in pea
Moreno, R.R. and Polans, N.O.                                                            Dept. of Biol. Sci. and Plant Mol. Biol. Center
Northern Illinois Univ., DeKalb, IL, USA
Microsatellite DNA is comprised of rapidly evolving tandem arrays of 1-6 nucleotides in head-to-tail repeat motifs commonly including fewer than 60 units (5-6). Most microsatellite sequences are located in untranslated DNA between genes and, therefore, are unlikely to be affected directly by natural selection (5-6). For this reason, microsatellite loci can serve as highly informative neutral molecular markers in a variety of applications. In previous studies involving pea, microsatellite-based molecular markers have been used to determine inter-genera transferability of primers (7), to analyze diversity within the genus Pisum (3) and to estimate the level of microsatellite polymorphism in Pisum sativum L. (2). Sequence Tagged Microsatellite Sites (STMS) primarily are used to determine sequence length polymorphism; STMS sequence length variations typically arise from the loss or gain of microsatellite repeat units via polymerase slippage. RAMS (Randomly Amplified MicroSatellites), a novel molecular marker technique (3), extends the application of STMS by employing microsatellite-specific primer sets at lower PCR annealing temperatures to produce less-specific multi-banded DNA profiles. It is assumed that the STMS locus is amplified along with these less-specific loci during the RAMS procedure. In the present study we: 1) develop and characterize novel pea microsatellite loci (STMS) and then 2) evaluate RAMS profiles for pea accessions representing the range of the genus using primer sets developed for the STMS loci.
Materials and Methods
Total genomic DNA was extracted from P. sativum ssp. sativum accession PI179449, using 100 mg of fresh tissue. Approximately 4 pg of genomic DNA was digested with Rsa I, BstU I and Alu I restriction enzymes in separate reactions overnight at 37oC (4), after which double-stranded SNX adaptors were ligated to the resulting pea DNA fragments. Ligated DNA fragments from each of the restriction digests were hybridized with microsatellite complementary sequences using step-down programming (4) in a MJ Research PTC-100 thermal cycler. Four different biotinylated microsatellite probe mixtures acquired from the Savannah River Ecology Laboratory were used in separate hybridization reactions (Mixture #1: AACC5, AACG5, AAGC5, AAGG5, ATCC5, AC13; Mixture #2: TG12, AG12, AAG8, ATC8, AAC8, AAT12, ACT12; Mixture #3: AAAC6, AAAG6, AATC6, AATG6, ACCT6, ACAG6, ACTC6, ACTG6; Mixture #4: AAAT8, AACT8, AAGT8, ACAT8, AGAT8). The hybridized solutions were mixed with washed Dynabeads M-280 Streptavidin magnetic beads. The reactions subsequently were washed six times to remove un-hybridized DNA fragments. After each wash the Dynabeads , with hybridized DNA attached, were captured using a Magnetic Particle Collector (MPC). This method retained the microsatellite-containing pea DNA fragments bound to complementary probes while eliminating any unbound pea DNA strands. Each enriched pea DNA combination (e.g., Rsa I-cut DNA enriched with oligonucleotide mixture #3) was amplified by PCR, after which aliquots were separated on an agarose gel to ensure the successful recovery of appropriately sized (approximately 500 bp) DNA fragments. Prior to DNA cloning, the remaining PCR products were purified using a QIAquick PCR purification kit. The linear pDrive cloning vector supplied in the QIAGEN® PCR Cloningp us Kit (see Fig. 1) has a uracil “overhang” that provides efficient U-A base ligation with purified PCR products. Ligation of enriched pea DNA with the pDrive cloning vector resulted in “nested” primer sites in which pea DNA fragments flanked by SNX sequences were inserted into a vector containing M13 universal primer sequences flanking the insertion site. Once the vector-ligation reaction was complete, bacterial transformation of QIAGEN EZ Competent Cells was conducted using 2 mkl of the ligation reaction mixture according to manufacturer specifications. Transformed bacteria were grown at 37oC for 24 hours on LB agar plates containing X-gal, IPTG and ampicillin. The plasmid vector contained in positive colonies then was amplified via PCR using M13 forward (-20) and M13 reverse primers. PCR products were separated on an agarose gel to ensure that the insert was an appropriate size (<600 bp) for sequencing reactions. Bacterial colonies containing an appropriately sized insert were placed in culture tubes containing 3 ml LB broth plus ampicillin and incubated at 37oC in an
10
Pisum Genetics
2006—Volume 38
Research Papers
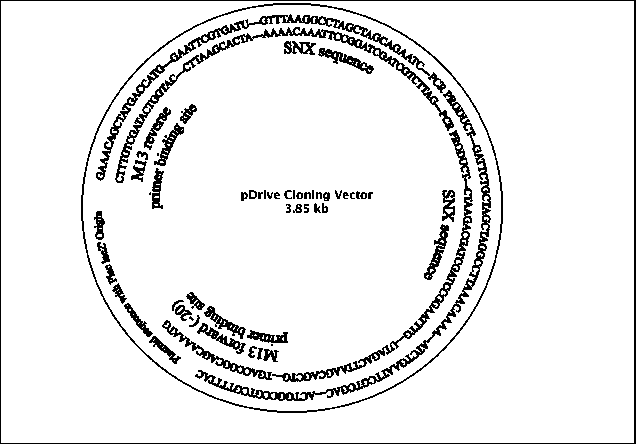
Fig. 1 Graphical representation of the pDrive Cloning Vector. Pea DNA was amplified using the SNX sequence in a PCR reaction. The Taq polymerase leaves a deoxyadenosine base to which the uracil overhang at the vector insertion sites attaches. Pea DNA is nested between SNX primer sites which are nested in turn between M13 universal primer binding sites. SNX primers were used to verify pea DNA insertion, while M13 primers were used to check insert size and in subsequent DNA sequencing reactions. Sequence shown between the M13 and SNX primer binding sites is a portion of the plasmid vector sequence at the site of PCR product insertion (8).
incubator shaker at 200 rpm overnight. Plasmid DNA was recovered from the bacteria using a QIAprep® spin miniprep kit and eluted in ddH2O.
Sequencing reactions were conducted in the Core DNA Facility at Northern Illinois University using M13 forward (-20) and M13 reverse primers. SNX and microsatellite DNA sequences were detected as text-format sequencing data using a word processing program and the “Find” command. Text-format sequence data that contained microsatellite DNA sequences were imported into the Primer3 program (9) used to design microsatellite-specific primers. Optimal primer length was set at 20 bp, optimal Tm was set at 60oC and primer GC content was adjusted to a minimum of 20% and maximum of 80%. Resulting primer sets were ordered from either MWG Biotech (High Point, NC) or Sigma Genosys (The Woodlands, TX).
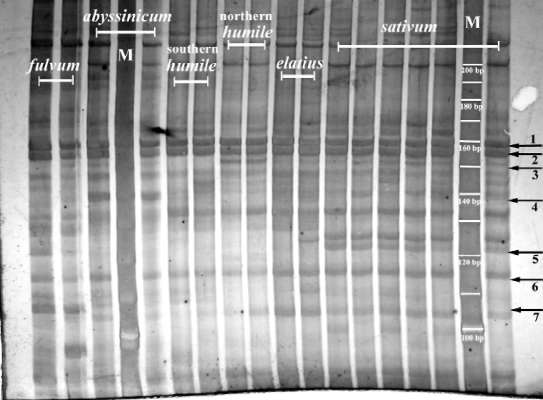
Pea DNA accessions representing the range of the genus Pisum were amplified with each primer set to evaluate detectable differences using the RAMS method [PCR: 15.65 mkl ddH2O, 2.5 mkl 10x PCR buffer, 2.5 mkl MgCl2 (25mM), 1.25 mkl dNTPs (2.5 mM), 1 mkl each forward and reverse primer (100 pmol/pl) and 1 U Taq polymerase; cycle conditions: 95oC for 5 min, then 45 cycles of 95oC for 30 sec, 35oC for 30 sec and 72oC for 2 min)]. PCR products (5-6 pl) from all primer sets and a single-stranded 10 bp molecular marker were separated on 20 cm x 0.75 mm 6% polyacrylamide denaturing gels run under constant voltage (800 V) for
11
Pisum Genetics
2006—Volume 38
Research Papers
approximately 2 hours. Gels were stained using a Bio-Rad Silver Stain plus kit and preserved in cellophane. Clearly discernable polymorphic and monomorphic bands between 90-300 bp in size were scored as “present”, “absent” or “uncertain” for all accessions. Additionally, STMS loci were identified using P.s. ssp. sativum PI179449 DNA in a series of PCR reactions with increasing primer annealing temperatures to isolate a single DNA band in the RAMS profile. Preserved gels were photographed using a Nikon CoolPix 950 digital camera mounted above a white light box. The digital gel images were cropped and labeled using Adobe Photoshop v. 6.0 (see, e.g., Fig. 2).
Fig 2. RAMS bands produced using primer set #14 on pea DNA representing the range of the genus Pisum. From left to right: fulvum (703 and 707), abyssinicum (JI2 and JI225), southern humile (713 and 714), northern humile (716 and JI1794), elatius (721 and 722) and sativum (JI228, JI264, JI787, JI1035, JI1372 and cv. Alaska). JI denotes accessions from the John Innes collection, population isolates 703-722 are from the Ben Ze’ev and Zohary (1) collection and cv. Alaska is from J. Mollema and Son, Inc. (Grand Rapids, MI). Both monomorphic bands (1, 2 and 6) and polymorphic bands (3, 4, 5 and 7) are observed. Band #3 is evident only in northern humile, while band #4 is evident only in abyssinicum. Band #5 is present in sativum and band #7 is present only in fulvum. Two lanes, denoted by “M” contain a 10-bp molecular size standard; the brightest band towards the bottom of the gel represents 100 bp. The 6% polyacrylamide gel was treated with silver stain and preserved in cellophane. Digital image was captured using a Nikon CoolPix 950 digital camera mounted above a white light box. Molecular marker sizes (bp), arrows and accessions were added using Adobe PhotoShop v. 6.0.
Results and Discussion
Two hundred twenty-seven plasmid vectors were recovered from the cloning exercises describe in Materials and Methods and then were quantified for DNA concentration. Forty-four of the plasmid DNA samples displayed suitable concentrations (~100 ng/pl) for immediate DNA sequencing. The remaining 183
12
Pisum Genetics
2006—Volume 38
Research Papers
samples required either dilution with ddH2O or concentration with 3M NaOAc in order to be sequenced. These samples were stored at -20oC for future use. Twenty-one of the 44 sequenced samples (47%) did not contain microsatellite DNA even though the hybridized solutions were washed six times to remove non­specific fragments. Seven sequences that contained mono-nucleotide sequences (poly A and poly G) also were not included in our analyses because they are difficult to use when estimating length polymorphisms. Finally, two sequences that contained fewer than four repeat units of TG were not used because microsatellite DNA usually is defined by six or more repeat units. The mono-nucleotide microsatellites and short TG repeat microsatellites likely hybridized weakly with complementary microsatellite probes among the 26 different Savannah Laboratory sequences. The remaining 14 samples sequenced (32%) contained 18 microsatellite DNA sequences. Four of these DNA samples contained two unique microsatellite loci; however, reverse primers could not be designed for either locus contained in one of the samples because the microsatellites were located too close to the sequence terminus. The remaining 13 microsatellite-containing sequences contained 16 microsatellites that were flanked by unique DNA from which primers could be developed (Table 1).
Table 1. Pea microsatellite DNA primer set sequences and characteristics.
Primer
Sequence 5’ -> 3’
Length (bp)
Micro-satellite Motif
Estimated PCR product size (bp)
1
F:TAGTTCGGTACCGCATGTGT
20 bp
R:ATGTATAATCTCAAACCATACTCAACA
24 bp
TG
10
136
2
F:TTGATTGATTCCATACAAGCCT
22 bp
R:ACCATGATTACGCCAAGCTC
20 bp
TG
8
297
3
F:CGCATGCATGGAGTCTCATT
20 bp
R:TGTGGAATTGTGAGCGGATA
20 bp
TG
8
274
4
F:CACGAACGGATTCCTTCAAT
20 bp
R:CAGAAGCATTTAATGGCGGT
20 bp
AG
12
155
5
F:CACGAACGGATTCCTTCAAT
20 bp
R:AGAAGCATTTAATGGCGGG
20 bp
TG
21
156
6
F:AAGCTTGTCGACGAATTCAGA
21 bp
R:GTTGAGTGGGGACGAAGAGG
20 bp
TC
8
135
7
F:ACGCACAAAAGGAAGGAAAA
20 bp
R:CCGGATAGATATCCTGCGAG
20 bp
AC
5
102
8
F:CAACCCACACAAATGGTTCTT
21 bp
R:AGCTGCTACGAATGAAGGCT
20 bp
AC
7
151
9
F:GCAACCCACACAAATGGTTC
20 bp
R:AGCTGCTACGAATGAAGGCT
20 bp
TC
22
151
10
F:AGCTGCTACCAATGAAGGCT
20 bp
R:AAAACCCTTGTCCAAAAGCA
20 bp
TGAG
5
124
11
F:ACGAATGAAGGCTTGGAGTG
20 bp
R:AAAACCCTTGTCCAAAAGCA
20 bp
AG
21
117
12 13 14 15 16
F:CGATATCCTGCCGAGTCAGT
R:CACGCACACTAGAAATGGGA
F:ACGAACAAGAACCAAAGGCA
R:TGTGGAATTGTGAGCGGATA
F:AAGCTTGTCGACGAATTCAGA
R:TTGAAAACCAAAGCAAGCAA
F:AGCTGGTACGAATGAAGGCT
R:AATCTGAAGCCCACACAAGG
F:AAGGGCAAAGACTCTCTCTCG
R:TGTGGAATTGTGAGCGGATA
20 bp 20 bp 20 bp
20 bp
21 bp 20 bp 20 bp
20 bp
21 bp 20 bp
TG
7
TGA
4
TCTA
11
AG
18
CAA
7
112 290 149 137 268
13
Pisum Genetics
2006—Volume 38
Research Papers
Twelve of the 16 microsatellite loci detected contained dinucleotide motifs, while two possessed trinucleotide motifs and another two contained tetranucleotide motifs. Seven of the 12 dinucleotide microsatellite loci were perfect arrays of which the shortest locus (detectable with primer set #7) consisted of 5 AC units and the longest locus (detectable with primer set #11) consisted of 21 AG units. The longest dinucleotide micro-satellite locus (detectable with primer set #9) consisted of 22 imperfect repeat units of TC with two transi­tion (C —► A) mutations. One of the two trinucleotide microsatellite loci we discovered consisted of 4 units of TGA. Ordinarily only DNA segments with 5 or more repeat units are employed as microsatellites (5); how­ever, because the repeats were perfect in this case, we have retained them in our study. The other trinucleo­tide microsatellite locus contained 7 imperfect units of CAA (with one A —► G transition mutation). Both tetranucleotide microsatellite loci consisted of imperfect repeat units. One contained 5 TGAG units with 1 G insertion and 1 AG insertion, while the other contained 11 TCTA units with 3 transition mutations (all A —► G).
Eight of the 16 primer sets (#1, #2, #4, #7, #9, #12, #13 and #15) produced only monomorphic bands on 6% polyacrylamide gels when applied to 17 pea accessions representing taxa similar to those depicted in Fig. 2. Four of the 16 primer sets (#6, #8, #10 and #11) produced 18 scoreable bands on 6% polyacrylamide gels using the same 17 accessions. Fourteen of the 18 DNA bands were polymorphic, ranging in size from 110-270 bp. Two of the four monomorphic bands were 135 bp in length, and the other two monomorphic bands both were 150 bp in length. The remaining four of the 16 primer sets (#3, #5, #14 and #16) produced 19 scoreable bands on 6% polyacrylamide gels when applied to a much larger sample of 64 pea accessions. Fifteen of these 19 DNA bands were polymorphic and ranged in size from 105-240 bp. The four monomorphic bands detected ranged in size from 122 bp to 220 bp. On average, each polymorphic primer set generated nearly five DNA bands, with an average fragment length of 165 bp. Primer set #10 yielded three DNA bands, the fewest of the 8 poly-morphic primer sets, while primer set #6 produced 6 DNA bands, the most of the 8 polymorphic primer sets.
STMS loci were localized within the RAMS banding profiles using PI179449 DNA in combination with primer sets #3 (230 bp), #14 (158 bp) and #16 (255 bp), and are consistent with the putative PCR product size determined during primer set design (see Table 1). The STMS locus amplified by primer set #5 could not be localized unambiguously.
Using the RAMS method some general patterns of association among pea taxa can be detected on the preserved gels. In Fig. 2, for example, bands #1 (~160 bp), #2 (~155 bp) and #6 (~115 bp) are monomorphic across all accessions. Band #3 (~150 bp) is present in northern P.s. ssp. humile only. Band #4 (~140 bp) is present in only the P.s. ssp. abyssinicum accessions. Band #5 (~125 bp) is present in the six P.s. ssp. sativum accessions, and band #7 (~105 bp) is present only in the two P. fulvum accessions. These novel microsatellite molecular markers should be useful in a number of applications, including an examination of the relationships among the cultivated peas and their wild relatives.
Acknowledgement: This work was supported by funds from the Department of Biological Sciences and the Plant Molecular Biology Center, Northern Illinois University.
1.  Ben Ze’ev, N. and Zohary, D. 1973. Israel J. Bot. 22: 73-91.
2. Burstin, J., Deniot, G., Potier, J., Weinachter, C., Aubert G. and Baranger A. 2001. Plant Breed. 120: 311-317.
3. Ford, R., Le Roux, K., Itman, C., Brouwer, J.B. and Taylor, P.W.J. 2002. Euphytica 124: 397-405.
4. Glenn, T.C. 2001. Savannah River Ecol. Lab publication.
5. Goldstein, D.B. and Pollock, D.D. 1997. J. of Hered. 88: 335-345.
6. Jarne, P and Lagoda, P.J.L.. 1996. Tree 11: 424-429.
7. Pandian, A., Ford, R. and Taylor, P.W.J. 2000. Plant Mol. Bio. Rep. 18: 395a-395h.
8. QIAGEN® PCR Cloning Handbook for QIAGEN PCR Cloning Kit and QIAGEN PCR Cloning plus Kit. 2001. In-house publication
9. Rozen, S. and Skaletsky, H.J. 2000. In: Krawetz, S and Misener, S. (eds.) Bioinformatics Methods and Protocols: Methods in Molecular Biology. Humana Press, Inc., Totowa, NJ, U.S.A., pp. 365-386.
14