Evidence for the linkage sequence st…b…Np…le.
Murfet, I.C.The st…b and Np…le segments are shown on separate linkage groups in pea linkage maps based principally on conventional markers [2, 6, 10]. In the map of Weeden et al. [10], the st segment is in group III and the le segment in group IVB. However, three recent maps based principally on molecular markers [3, 4, 7] indicate that the st and le segments are on one chromosome. We present here evidence from conventional markers which supports that conclusion.
Hobart line 31 (m st b np le) was crossed with John Innes Centre lines JI241 (M St B Np Le) and JI263 (m St B Np Le). Thus all m arkers are in coupling phase. The markers M (seed coat marbling), st (small stipules) and b (pink wing petals) are in group III and markers Np (neoplastic pod) and le (dwarf stature) are in group IVB [10]. Quite fortuitously, a further group III marker entered the cross in coupling phase. The two HL31 plants used as female parents carried a recessive mutation conferring male sterility. One plant was homozygous and the other heterozygous for the mutant allele which arose spontaneously and appeared for the first time in this progeny.
Multiple marker line HL31 was originally provided by Prof Robert Lamm as Lamm line 31 and the JI lines were provided by Mike Ambrose. JI241 is a Pisum humile accession from Israel and JI263 is a P. sativum accession from the Balkans. F2 seeds and controls were sown in the glasshouse at Hobart on Oct. 27. Plants were grown at a rate of two per 14-cm pot under an 18-h photoperiod which was obtained by extending the natural day (> 15 h) with light from banks of 100-W incandescent globes and 40-W cool white fluorescent tubes. The joint segregation (linkage) Chi-square was obtained using a 2 ? 2 contingency table and the recombination value calculated by the product-ratio method using Steven’s Tables [9].
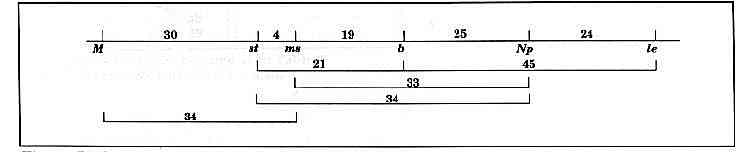
The results are presented in Table 1 and Fig. 1. The F1 plants of both crosses were fully fertile. All six markers segregated in accordance with a 3:1 ratio (Table 1). The linkage analysis supports the view that the six markers form part of a single linkage group in the sequence M…st…ms…b…Np…le (Table 1, Fig. 1). The b and Np loci showed linkage in both crosses. The linkage Chi-square for the combined data for these two loci is significant at P < 0.000001 but the linkage is fairly loose with a distance of 25 ± 5 cM. However, the maps based on closely spaced molecular markers [3, 4, 7] leave little doubt that the st and le segments are on the same chromosome. The present data support that conclusion and indicate that the orientation of the conventional markers is st…b…Np…le.
Fig. 1. Linkage map based on the data in Table 1. Distances in centiMorgans.
Table 1. F2 segregation data for crosses 976 (HL31x JI241) and 977 (HL31 x JI263). HL31 is recessive for all markers| Loci |
Cross |
Phenotype1 | Total |
Chi-square | Joint | RCV |
SE |
|||||
| DD | DR | RD | RR | Locus 1 | Locus 2 | Joint | Chi-sq prob | |||||
| st ms | 976 | 70 | 5 | 2 | 19 | 96 | 0.50 | 0 | 61.46 | < 0.0001 | 7.1 | 2.7 |
| 977 | 57 | 0 | 0 | 17 | 74 | 0.16 | 0.16 | 74.00 | < 0.0001 | 0 | 0 | |
| Comb | 127 | 5 | 2 | 36 | 170 | 0.64 | 0.07 | 133.36 | < 0.0001 | 3.9 | 1.5 | |
| b st | 976 | 65 | 11 | 10 | 10 | 96 | 0.89 | 0.50 | 11.69 | < 0.001 | 27.5 | 5.5 |
| 977 | 66 | 6 | 8 | 16 | 96 | 0 | 0.22 | 34.67 | < 0.0001 | 16.0 | 4.2 | |
| Comb | 131 | 17 | 18 | 26 | 192 | 0.44 | 0.69 | 44.22 | < 0.0001 | 21.4 | 3.5 | |
| b ms | 976 | 65 | 11 | 7 | 13 | 96 | 0.89 | 0 | 21.56 | < 0.0001 | 21.5 | 4.8 |
| 977 | 51 | 5 | 6 | 12 | 74 | 0.02 | 0.16 | 25.66 | < 0.0001 | 16.5 | 4.8 | |
| Comb | 116 | 16 | 13 | 25 | 170 | 0.64 | 0.07 | 46.44 | < 0.0001 | 19.5 | 3.5 | |
| b Np | 976 | 70 | 6 | 10 | 10 | 96 | 0.89 | 3.56 | 20.21 | < 0.0001 | 20.9 | 4.8 |
| 977 | 58 | 14 | 10 | 14 | 96 | 0.02 | 0.89 | 13.18 | < 0.001 | 27.7 | 5.5 | |
| Comb | 128 | 20 | 20 | 24 | 192 | 0.64 | 0.44 | 32.33 | < 0.0001 | 24.8 | 3.7 | |
| ms Np | 976 | 62 | 10 | 18 | 6 | 96 | 0 | 3.56 | 1.60 | > 0.2 | 40.1 | 6.8 |
| 977 | 47 | 10 | 7 | 10 | 74 | 0.16 | 0.16 | 11.31 | < 0.001 | 26.2 | 6.1 | |
| Comb | 109 | 20 | 25 | 16 | 170 | 0.07 | 1.33 | 10.31 | < 0.005 | 33.4 | 4.6 | |
| st Np | 976 | 65 | 10 | 15 | 6 | 96 | 0.50 | 3.56 | 2.74 | > 0.05 | 37.1 | 6.5 |
| 977 | 58 | 16 | 10 | 12 | 96 | 0.16 | 0.89 | 8.90 | < 0.01 | 30.9 | 5.9 | |
| Comb | 123 | 26 | 25 | 18 | 192 | 0.64 | 0.44 | 11.26 | < 0.001 | 33.7 | 4.4 | |
| le Np | 976 | 70 | 7 | 10 | 9 | 96 | 1.39 | 3.56 | 16.08 | < 0.0001 | 23.3 | 5.1 |
| 977 | 57 | 11 | 11 | 17 | 96 | 0.89 | 0.89 | 19.04 | < 0.0001 | 24.4 | 5.2 | |
| Comb | 127 | 18 | 21 | 26 | 192 | 0.03 | 0.44 | 36.99 | < 0.0001 | 23.6 | 3.6 | |
| b le | 976 | 63 | 13 | 14 | 6 | 96 | 0.89 | 1.39 | 1.66 | > 0.1 | 40.0 | 6.8 |
| 977 | 51 | 21 | 17 | 7 | 96 | 0.02 | 0.89 | 0 | = 1 | 50.0 | 7.7 | |
| Comb | 114 | 34 | 31 | 13 | 192 | 0.64 | 0.03 | 0.79 | > 0.3 | 45.3 | 5.1 | |
| le ms | 976 | 56 | 21 | 16 | 3 | 96 | 1.39 | 0 | 1.07 | = 0.3 | > 57 | |
| 977 | 40 | 14 | 17 | 3 | 74 | 0.89 | 0.16 | 0.98 | > 0.3 | > 57 | ||
| Comb | 96 | 35 | 33 | 6 | 170 | 0.03 | 0.07 | 2.11 | > 0.1 | > 57 | ||
| st le | 976 | 59 | 16 | 18 | 3 | 96 | 0.50 | 1.39 | 0.51 | > 0.3 | > 56 | |
| 977 | 51 | 23 | 17 | 5 | 96 | 0.22 | 0.89 | 0.57 | > 0.3 | > 56 | ||
| Comb | 110 | 39 | 35 | 8 | 192 | 0.69 | 0.03 | 1.03 | > 0.3 | > 56 | ||
| st M | 976 | 61 | 14 | 10 | 11 | 96 | 0.50 | 0.06 | 9.68 | < 0.002 | 29.8 | 5.8 |
| ms M | 976 | 58 | 14 | 13 | 11 | 96 | 0 | 0.06 | 6.51 | < 0.02 | 33.4 | 6.1 |
| b M | 976 | 56 | 20 | 15 | 5 | 96 | 0.89 | 0.06 | 0.01 | > 0.9 | 51.0 | 7.7 |
| Np M | 976 | 58 | 22 | 13 | 3 | 96 | 3.56 | 0.06 | 0.53 | > 0.3 | > 56 | |
1 D, dominant; R, recessive. The first named locus is shown first.
It is surprising that the linkage between the st and le segments did not come to light in earlier studies with conventional markers. Blixt [1] obtained the following results for marker chi6: st…chi6, 30 ± 4 cM (P < 0.0001); b…chi6, 22 ± 5 cM (P < 0.000001); le…chi6, 29 ± 4 cM (P < 0.001). These results look to be in good agreement with our data assuming chi6 is located in the vicinity of Np. However in contradiction to that assumption, Blixt found little or no evidence of linkage between chi6 and vim or pro, two loci in the vicinity of Np, and he assigned chi6 to a position distal to b in group III. Lamm and Miravalle [5] observed linkage between le and st but attributed this to their being on different wild-type chromosomes involved in a translocation. We can re-interpret their data as indicating that a translocation involving this region suppressed recombination between le and st located on the same wild-type chromosome.Myers and Gritton [8] mapped the male sterility locus ms6 between st and b. Thus the ms locus involved in the present crosses may be ms6, but this hypothesis requires an allelism test for confirmation.
Acknowledgement. We thank the Australian Research Council for financial support.
1. Blixt, S. 1969. Agri Hort. Genet. 27:36-52.
2. Blixt, S. 1972. Agri Hort. Genet. 30:1-293.
3. Ellis, T.H.N., Poyser, S.J., Knox, M.R., Vershinin, A.V. and Ambrose, M.J. 1998. Mol.
Gen. Genet. 260:9-19.
4. Gilpin, B.J., McCallum, J.A., Frew, T.J. and Timmerman-Vaughan, G.M. 1997. Theor. Appl.
Genet. 95:1289-1299.
5. Lamm, R. and Miravalle, R.J. 1959. Hereditas 45:417-440.
6. Lamprecht, H. 1961. Agri Hort. Genet. 19:360-401.
7. Laucou, V., Haurogne, K., Ellis, N. and Rameau, C. 1998. Theor. Appl. Genet.
97:905-915.
8. Myers, J.R. and Gritton, E.T. 1988. Euphytica 38:165-174.
9. Stevens, W.L. 1939. J. Genet. 39:171-180.
10. Weeden, N.F., Swiecicki, W.K., Timmerman-Vaughan, G.M., Ellis, T.H.N. and Ambrose, M.
1996.
Pisum Genetics 28:1-4.