A consensus linkage map for Pisum sativum
Assembled by the Linkage Committee, December, 1998
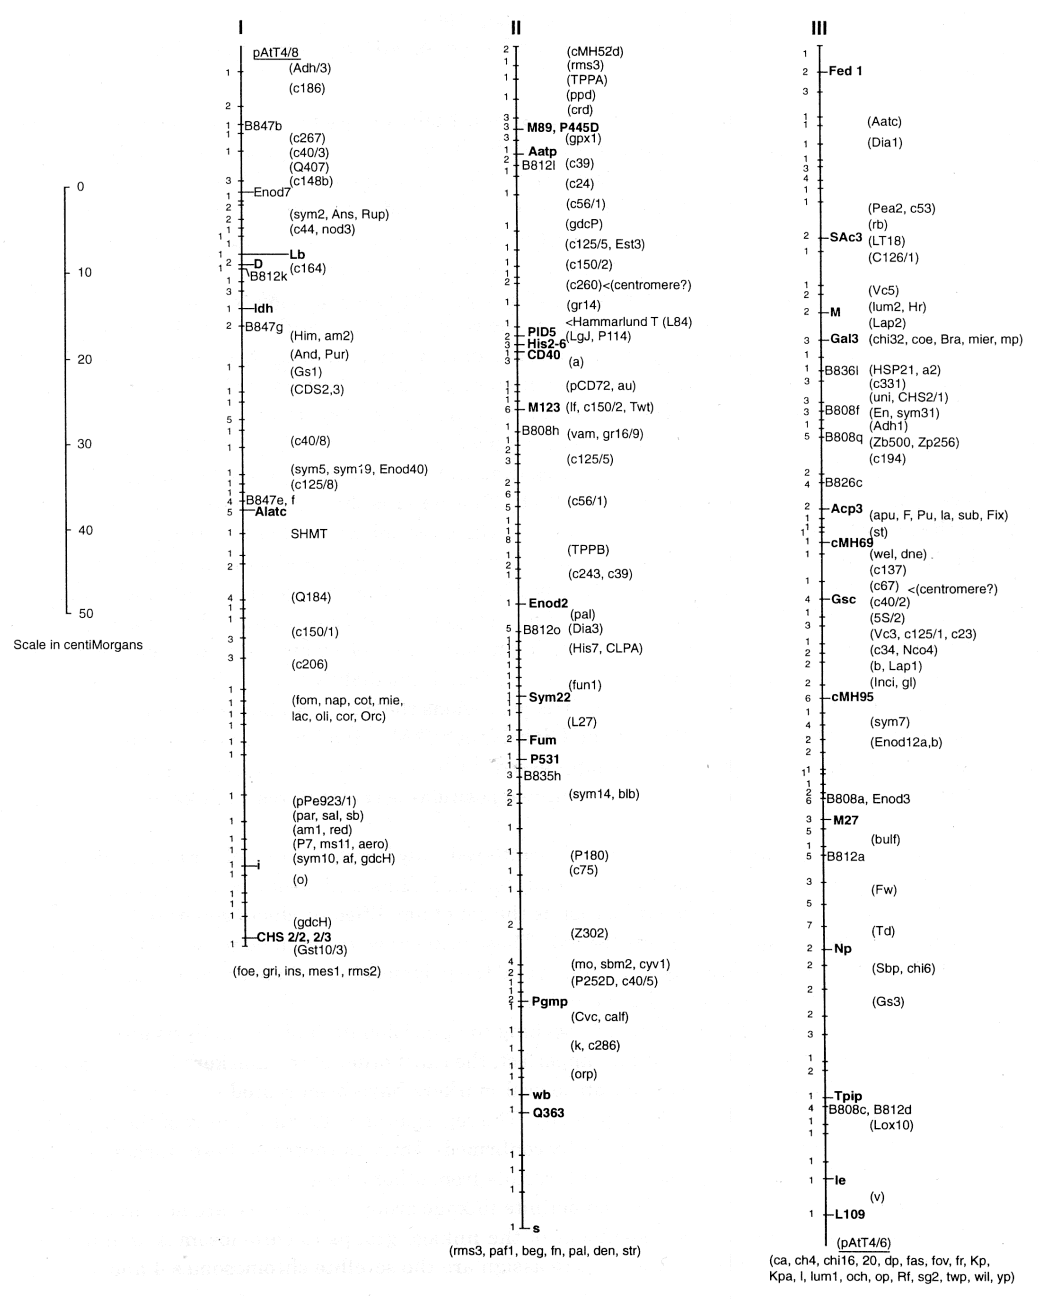
(N.F. Weeden, T.H.N. Ellis, G.M. Timmerman-Vaughan, W.K. Swiecicki, S.M. Rozov, and V.A. Berdnikov) The map presented on the following pages actually represent two parallel maps of the pea genome. One map is given as a set of seven solid vertical lines, corresponding to the seven linkage groups identified in a mapping population of 51 recombinant inbred lines (F10 RILs) derived by single seed descent from a JI1794 x Slow F2. The second map consists of a column of mostly familiar marker loci which did not segregate in the RIL population but whose positions relative to markers segregating in this population are sufficiently well known to approximate their location on the primary map. The combined ‘consensus’ map represents an update of the map published in Volume 28 of Pisum Genetics and includes the very satisfying results of Murfet and Ellis (this volume pp 12-14) that the linkage segment containing Np and le (formerly referred to as LG IVB) is actually part of LG III. Hence, the seven linkage groups in the standard karyotype of pea are clearly established and have been confirmed in the JI1794 x Slow RILs.The linkage distances on the present map were determined solely on the basis of the data from the approximately 850 markers segregating in the RIL population. Distance calculations were performed using the equation r = R/(2-2R) [2] where r is the recombination frequency and R is the proportion of recombinant inbred lines in which recombination has occurred. With 51 lines in the population, one recombinant is equal to one centiMorgan, and this value represents the precision of the map. The map spans nearly 800 cM, with the linkage groups all approximately 100 cM in length (Table 1). Only 465 unique segregation patterns (indicated by the cross bars) are distinguished among the markers, giving a saturation of about 1 marker per 2 cM. The number of markers mapped to each cross bar is given immediately to the left. Up to 15 markers were mapped to specific cross bars, and in some regions the markers appeared to cluster (a cluster defined as more than ten markers at a density of >2/cM). Such clusters have been associated with regions where recombination is suppressed, such as around centromeres. However, on this map, clusters do not coincide with the suspected positions of centromeres on linkage groups II, III or V.
In order to keep the map relatively uncluttered, only loci that are easily transferable among crosses (classical mutants, allozyme polymorphisms, RFLPs and sequence tagged sites) are labeled. An exception to this generalization is the set of amplified products generated by primers containing simple sequence repeats (SSRs). These primers were obtained from the University of British Columbia Biotechnology Laboratory, and the polymorphisms generated are labeled B808, etc., reflecting the source and primer number.
With the density of markers approaching the precision limit of the analysis and the accuracy of scoring certain RAPD markers imperfect, the exact order of the markers in many regions is uncertain. Both isozyme and morphological markers have been scored at least twice in advanced lines from the JI 1794 ? Slow progeny. The segregation patterns of many of the RFLP and STS markers also have been independently confirmed. Thus, the order of these ‘anchor’ markers is firmly established and agrees well with results from other crosses.
With the establishment of seven definite linkage groups for pea, we are now in a position to give at least a preliminary assignment of the linkage groups to chromosomes as numbered according to Blixt [1]. The easiest pairs to assign are the satellite chromosomes 4 and 7, which must correspond to linkage groups IV and VII, these two containing the 45S ribosomal arrays Rrn1 and Rrn2. Folkeson [4] determined that the marker oh belongs to chromosome 4. As this marker is clearly associated with LG VII, the pairing appears to be LG IV with chromosome 7 and LG VII with 4. The studies of Folkeson [3] and the confirming studies by Hall et al. [5] have clearly established that LG III is chromosome 5 and LG V is chromosome 3. Another important piece of evidence comes from Hammarlund’s translocation, L84. The translocation involves chromosomes 3 and 6, and the breakpoints have been carefully mapped to the positions indicated on LG II and LG V. Thus, LG II can be paired with chromosome 6. The two shortest linkage groups (LG I and LG VI) now must be matched with the short chromosomes 1 and 2. As indicated in Blixt [1] and summarized in Temnykh and Weeden [6], considerable evidence pairs LG VI with chromosome 2, although this evidence is not incontrovertible. Thus, by default, LG I is matched with chromosome 1 (Table 1). Although direct evidence for this last pairing is lacking, it is consistent with nearly all previous data generated from studies on translocation tester lines. None of the markers on LG I (specifically i, af, and d) has displayed linkage with translocation break points, particularly those known to involve chrmosomes other than chromosome 1. However, further data is needed before the assignments in Table 1 can be confidently accepted. In addition, a different numbering system for the chromosomes, for instance one based on physical length, may be more appropriate for a final designation.
Concensus Linkage Map for Pisum sativum
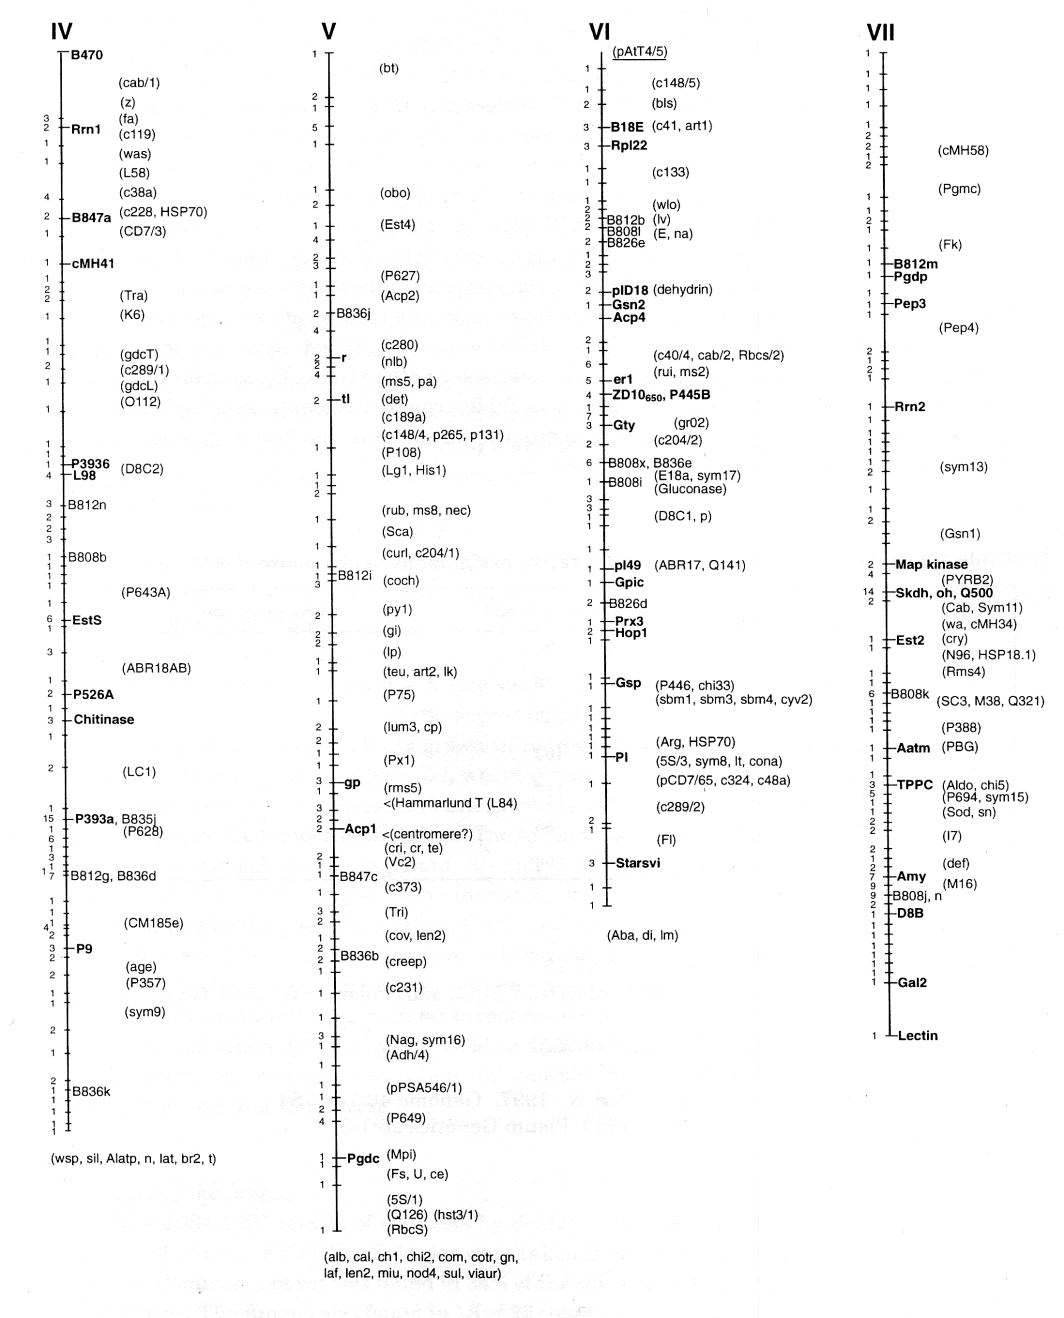
Table 1. Length of linkage groups and tentative assignment to chromosomes
| Linkage group | Map Length | Chromosome |
| I | 97 | 1 |
| II | 130 | 6 |
| III | 130 | 5 |
| IV | 103 | 7 |
| V | 117 | 3 |
| VI | 85 | 2 |
| VII | 100 | 4 |
1. Blixt, S. 1959. Agri Hort. Genet. 17:47-75.
2. Burr, B., Burr, A.F., Thompson, K.H., Albertson, M.C., and Stuber, C.W. 1988. Genetics 118:519-526.
3. Folkeson, D. 1990. Hereditas 112:249-255.
4. Folkeson, D. 1990. Hereditas 112:257-263.
5. Hall, K.J., Parker, J.S., and Ellis, T.H.N. 1997. Genome 40:744-754.
6. Temnykh, S.V. and Weeden, N.F. 1993. Pisum Genetics 25:1-3.