|
Pisum Genetics |
Volume 25 |
1993 |
Research Reports |
pages 46-51 |
A new version of pea linkage group 5
|
Rozov, S.M., Temnykh, S.V., Gorel', F.L. and Berdnikov, V.A. |
Institute of Cytology and Genetics Novosibirsk, 630090 Russia |
Within the past few years considerable revision of the Lamprecht-Blixt pea genetic map has occurred. Not only have certain markers been located more accurately, but significant segments of the linkage map have been rearranged. Recently linkage groups 5 and 7 were combined to form a new linkage group 5 (2, 11), although the first genetic data indicating linkage between genes gp – coch – tl were obtained in the sixties by Wellensiek (12) and Marx (3). Nowadays, there is considerable evidence that in the standard karyotype the genes bt – r – tl – coch – gp – Fs are located on a single chromosome which corresponds to the new linkage group 5. However, many of the well known genetic markers, clearly assigned to this linkage group, have not been located precisely, and the gene order on linkage group 5 is still uncertain.
Previously we localised gene His1 coding for the fraction of histone H1 with the lowest electrophoretic mobility (5, 6), the gene for the major pea seed albumin component, Sca (or SA-K9) (6, 9), and the protease inhibitor gene cluster, lp (7), near the r – tl segment of group 5. Our colleague O.G. Smirnova localised a new legumin fraction, Lg-u, near the His1 gene (8). Over the past several years we have carried out a number of crosses which permit more precise relative placement of some markers in linkage group 5, including genes bt, det, coch, curl, gp, and cri. We present the results here. The data were analysed using the program LINKAGE-1.
Wiatrowo line Wt-11745 (wsp, Bt, Det, r, Tl, His1s, coch, Scas) was crossed with our tester line RT-2 (Wsp, bt, det, r, tlw, His1ss, Coch, Scaf). The joint segregation data for the F2 population are presented in Table 1. Note that gene wsp segregates independently of all other markers involved in the analysis, in agreement with a suggestion that gene wsp is not a part of linkage group 5 (group 7 in Lamprecht's nomenclature) but forms with some other markers a segment of one of the satellite chromosomes (2).
Table 1. Joint segregation data obtained from the F2 of cross Wt-11745 (Bt, Det, tlw, His1s, Scas, coch, wsp) x RT-2 (bt, det, Tl, His1ss, Scaf, Coch, Wsp).
|
Genes |
Phase |
Number of progeny with designated phenotype1 |
Joint
seg. |
Recomb. frac. |
SE |
||||||||||
|
A/B |
A/h |
A/b |
h/B |
h/h |
h/b |
a/B |
a/h |
a/b |
|
||||||
|
bt |
det |
C |
137 |
-- |
23 |
-- |
-- |
-- |
20 |
-- |
20 |
24.1**** |
27.1 |
3.8 |
|
|
bt |
tl |
C |
50 |
85 |
25 |
-- |
-- |
-- |
2 |
20 |
18 |
21.4**** |
28.8 |
3.7 |
|
|
bt |
His1 |
C |
45 |
78 |
37 |
-- |
-- |
-- |
4 |
24 |
12 |
5.7 |
41.1 |
4.2 |
|
|
bt |
coch |
R |
118 |
-- |
42 |
-- |
-- |
-- |
36 |
-- |
4 |
4.8* |
34.8 |
6.1 |
|
|
bt |
Sca |
C |
43 |
80 |
37 |
-- |
-- |
-- |
4 |
25 |
11 |
5.1 |
42.3 |
4.2 |
|
|
det |
tl |
C |
60 |
105 |
5 |
-- |
-- |
-- |
1 |
5 |
45 |
163.2**** |
5.7 |
1.6 |
|
|
det |
His1 |
C |
58 |
93 |
19 |
-- |
-- |
-- |
1 |
18 |
32 |
63.3**** |
19.2 |
2.9 |
|
|
det |
coch |
R |
116 |
-- |
54 |
-- |
-- |
-- |
50 |
-- |
1 |
18.6**** |
14.3 |
6.6 |
|
|
det |
Sca |
C |
55 |
94 |
21 |
-- |
-- |
-- |
0 |
22 |
29 |
52.0**** |
21.2 |
3.0 |
|
|
tl |
His1 |
C |
57 |
15 |
3 |
23 |
87 |
13 |
0 |
14 |
39 |
183.8**** |
15.2 |
1.8 |
|
|
coch |
tl |
C |
53 |
104 |
19 |
-- |
-- |
-- |
1 |
19 |
57 |
105.2**** |
15.0 |
2.4 |
|
|
tl |
Sca |
C |
55 |
18 |
3 |
21 |
87 |
15 |
0 |
18 |
36 |
160.7**** |
16.8 |
1.8 |
|
|
coch |
His1 |
C |
54 |
116 |
5 |
-- |
-- |
-- |
1 |
0 |
75 |
224.1**** |
2.6 |
1.0 |
|
|
His1 |
Sca |
C |
73 |
7 |
0 |
2 |
112 |
2 |
0 |
4 |
51 |
418.7**** |
3.0 |
0.8 |
|
|
coch |
Sca |
C |
54 |
119 |
3 |
-- |
-- |
-- |
0 |
4 |
74 |
222.3**** |
2.5 |
1.0 |
|
|
wsp |
bt |
R |
116 |
-- |
32 |
-- |
-- |
-- |
44 |
-- |
8 |
0.9 |
44.0 |
5.6 |
|
|
wsp |
det |
R |
126 |
-- |
40 |
-- |
-- |
-- |
44 |
-- |
11 |
0.4 |
46.7 |
5.2 |
|
|
wsp |
tl |
C |
41 |
94 |
58 |
-- |
-- |
-- |
13 |
28 |
18 |
0.0 |
50.4 |
3.9 |
|
|
wsp |
His1 |
C |
42 |
92 |
57 |
-- |
-- |
-- |
13 |
24 |
22 |
1.3 |
47.6 |
3.9 |
|
|
wsp |
coch |
C |
138 |
-- |
55 |
-- |
-- |
-- |
38 |
-- |
21 |
1.1 |
45.8 |
4.9 |
|
|
wsp |
Sca |
C |
43 |
94 |
56 |
-- |
-- |
-- |
11 |
29 |
19 |
0.4 |
47.8 |
3.9 |
|
1 A,a - first gene; B,b - second gene; h - heterozygous. Where both genes are dominant, the capital letter stands for the dominant allele. Where the second gene is codominant, capital A stands for the dominant allele of the first gene and capital B for an allele of the second gene which is in coupling with A. Where both genes are codominant, the capital letter stands for an allele of the first parent.
*,**,***,**** p < 0.05, 0.01, 0.001 and 0.0001, respectively. Data were analysed by the LINKAGE-1 program.
Table 2. Joint segregation analysis for genes binding the r-tl and gp segments of linkage group 5.
|
Genes |
Number of progeny with designated phenotype1 |
Joint seg. c2 |
Recomb. frac. |
SE |
|||||||||
|
A/B |
A/h |
A/b |
h/B |
h/h |
h/b |
a/B |
a/h |
a/b |
|||||
|
a) F32: SGR "coch"(R, Tl, His1ss, Scaf, coch, Gp) x NGB-1238 (r, tlw, His1s, Scas, Coch, gp) |
|||||||||||||
|
coch |
tl |
60 |
136 |
8 |
-- |
-- |
-- |
1 |
14 |
54 |
163.7**** |
8.9 |
1.8 |
|
coch |
r |
140 |
-- |
64 |
-- |
-- |
-- |
68 |
-- |
1 |
25.4**** |
12.5 |
5.9 |
|
coch |
His1 |
67 |
135 |
2 |
-- |
-- |
-- |
0 |
5 |
64 |
237.2**** |
2.6 |
1.0 |
|
r |
tl |
62 |
145 |
1 |
-- |
-- |
-- |
0 |
5 |
60 |
240.9**** |
2.2 |
0.9 |
|
tl |
His1 |
56 |
5 |
1 |
10 |
129 |
11 |
0 |
6 |
55 |
362.7**** |
6.4 |
1.1 |
|
r |
His1 |
66 |
130 |
12 |
-- |
-- |
-- |
0 |
10 |
55 |
167.5**** |
8.3 |
1.7 |
|
coch |
gp3 |
25 |
-- |
17 |
-- |
-- |
-- |
7 |
-- |
1 |
2.3 |
26.9 |
12.9 |
|
gp |
His1 |
4 |
21 |
7 |
-- |
-- |
-- |
1 |
7 |
10 |
5.9* |
28.7 |
7.4 |
|
gp |
r |
7 |
17 |
8 |
-- |
-- |
-- |
2 |
7 |
9 |
3.3 |
34.4 |
7.9 |
|
gp |
tl |
7 |
17 |
8 |
-- |
-- |
-- |
2 |
7 |
9 |
3.3 |
34.4 |
7.9 |
|
b) F2: RT-l (r, tlw, His1f, Scaf, Curl) x NGB-5558 (R, Tl, His1s Scas, curl) |
|||||||||||||
|
Sca |
r |
22 |
7 |
0 |
4 |
53 |
5 |
0 |
7 |
29 |
136.2**** |
9.5 |
1.9 |
|
Sca |
tl |
23 |
6 |
0 |
3 |
55 |
4 |
0 |
6 |
30 |
153.9**** |
7.8 |
1.7 |
|
curl |
Sca |
36 |
61 |
0 |
-- |
-- |
-- |
0 |
1 |
29 |
121.5**** |
0.8 |
0.8 |
|
Sca |
His1 |
26 |
3 |
0 |
1 |
60 |
1 |
0 |
4 |
32 |
203.7**** |
3.6 |
1.2 |
|
r |
tl |
25 |
1 |
0 |
1 |
65 |
1 |
0 |
1 |
33 |
229.8**** |
1.6 |
0.8 |
|
curl |
r |
34 |
59 |
4 |
-- |
-- |
-- |
0 |
8 |
22 |
69.2**** |
10.1 |
2.8 |
|
r |
His1 |
22 |
4 |
0 |
5 |
58 |
4 |
0 |
5 |
29 |
156.2**** |
7.4 |
1.7 |
|
curl |
tl |
34 |
60 |
3 |
-- |
-- |
-- |
0 |
7 |
23 |
77.5**** |
8.4 |
2.5 |
|
tl |
His1 |
23 |
3 |
0 |
4 |
60 |
3 |
0 |
4 |
30 |
175.6**** |
5.7 |
1.5 |
|
curl |
His1 |
33 |
63 |
1 |
-- |
-- |
-- |
0 |
4 |
26 |
100.8**** |
4,1 |
1.8 |
1 The same designation as in Table 1.
2 F3 progeny of 3 heterozygous F2 plants from this cross.
3 Only one of the 3 F3 families was heterozygous for gene gp.
*,**,***,**** p < 0.05, 0.01, 0.001 and 0.0001, respectively.
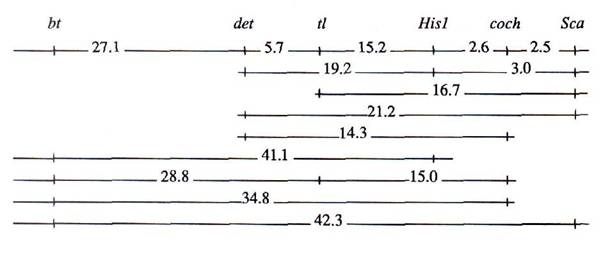
The results in Table 1 clearly indicate the following gene order:
The significant linkage between gene bt and genes surrounding gene r is in agreement with earlier work. As had been shown by Folkeson in his experiments involving translocation line L-25, the recombination fraction for r – bt, T – bt and T – r was 33.9 ± 2.3, 23.2 ± 2.99 and 3.1 ± 0.93, respectively (1).
The gene order in segment tl – His1 – coch – Sca was obtained after phenotypic analysis of individual recombinant plants. The presence of two double-crossover plants recombinant in both the tl – His1 and His1 – coch (or coch – Sca) segments, can explain the observed slight nonadditivity in this region.
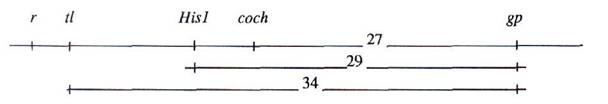
The position of gene coch was confirmed in a cross between our gamma-ray induced mutant line SGR-"coch" and NGB-1238. A cross between SGR-"coch" and line Wt-11745 (coch) showed both mutants were allelic. Unfortunately, due to root disease only a few F2 plants were obtained in cross SGR "coch" x NGB-1238. Thus the genetic analysis was carried out on the combined F3 progeny of three F2 plants heterozygous for genes r, tl, His1 and coch (Table 2). One of these F3 families showed segregation for gp. This enabled us to estimate the linkage and orientation of gene gp and the r – tl segment. Considering the data concerning the relative position of the markers near gene r given above, the following scheme is proposed:
The position of det was also confirmed by segregation data (Table 3) obtained from testcross: F1 (Svoboda x OS-1) x RF-3. The genotypes of these lines are: Svoboda (det, tl, His1s, Scas), OS-1 (Det, tl, His1ss, Scaf), and RT-3 (det, Tl, His1ssy Scaf). The position of curl was verified by the cross NGB-5558 (curl, R, Tl, His1s, Scas) x RT-1 (Curl, r, tlw, His1ss, Scaf). The segregation data for this cross are presented in Table 2b. Recombination data and results of crossover analysis (not shown) revealed the following gene order:
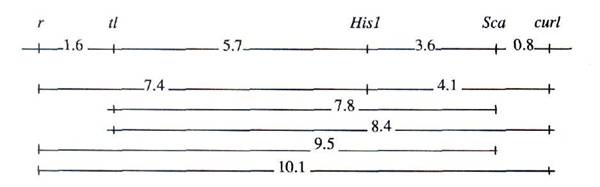
Table 3. Joint segregation data for genes His1, Sca, Tl and det obtained from the testcross F1 (Svoboda x OS-1) x RT-3.
|
Genes |
Phenotype classes1 |
Joint seg. c2 |
Recomb. frac. |
SE |
||||
|
H-H |
T-H |
H-T |
T-T |
|||||
|
His1 |
Sca |
36 |
3 |
2 |
27 |
49.2**** |
7.35 |
3.17 |
|
His1 |
det |
2 |
26 |
37 |
3 |
49.2**** |
7.35 |
3.17 |
|
His1 |
tl |
0 |
39 |
27 |
2 |
60.2**** |
2.94 |
2.05 |
|
Sca |
det |
4 |
24 |
34 |
6 |
33.4**** |
14.71 |
4.29 |
|
Sca |
tl |
2 |
36 |
25 |
5 |
42.9**** |
10.29 |
3.69 |
|
det |
tl |
26 |
2 |
1 |
39 |
56.5**** |
4.41 |
2.49 |
1 T = homozygous for the tester genotype; H = heterozygous.
**** P < 0.0001
Table 4. Joint segregation data a) for genes r and tl and markers gp and cri, and b) for markers in the gp-Fs segment of linkage group 5.
|
Genes |
Number of progeny with designated phenotype1 |
Joint seg. c2 |
Recomb. frac. |
SE |
|||||||||
|
A/B |
A/h |
A/b |
h/B |
h/h |
h/b |
a/B |
a/h |
a/b |
|||||
|
a) F2: NGB-1238 (r, tlw, gp, Cri) x SGE-182 (R, Tl, Gp, coch) |
|||||||||||||
|
cri |
gp |
58 |
-- |
44 |
-- |
-- |
-- |
24 |
-- |
1 |
13.4*** |
15.6 |
8.6 |
|
cri |
r |
42 |
45 |
16 |
-- |
-- |
-- |
5 |
9 |
7 |
4.3 |
36.1 |
5.1 |
|
cri |
tl |
42 |
54 |
22 |
-- |
-- |
-- |
4 |
15 |
10 |
6.4* |
36.6 |
4.7 |
|
gp |
r |
17 |
34 |
21 |
-- |
-- |
-- |
3 |
18 |
23 |
8.6* |
33.1 |
5.1 |
|
gp |
tl |
21 |
41 |
20 |
-- |
-- |
-- |
4 |
18 |
23 |
10.9** |
32.7 |
4.9 |
|
r |
tl |
45 |
2 |
0 |
1 |
52 |
1 |
0 |
1 |
22 |
218.9**** |
2.0 |
0.9 |
|
b) F2: NGB-1238 (gp, cp, U, fs) x SGE-185 (Gp, Cp, u, Fs) |
|||||||||||||
|
Fs |
cp |
53 |
-- |
9 |
-- |
-- |
-- |
5 |
-- |
2 |
0.9 |
32.2 |
7.1 |
|
Fs |
gp |
48 |
-- |
12 |
-- |
-- |
-- |
5 |
-- |
3 |
1.3 |
37.6 |
7.8 |
|
Fs |
U |
24 |
-- |
39 |
-- |
-- |
-- |
7 |
-- |
1 |
7.0** |
16.8 |
11.5 |
|
cp |
gp |
62 |
-- |
10 |
-- |
-- |
-- |
4 |
-- |
9 |
19.4**** |
20.6 |
5.0 |
|
cp |
U |
22 |
-- |
36 |
-- |
-- |
-- |
9 |
-- |
2 |
7.2** |
23.3 |
11.3 |
|
gp |
U |
21 |
-- |
32 |
-- |
-- |
-- |
9 |
-- |
6 |
2.0 |
39.3 |
10.1 |
1 The same designation as in Table 1.
*,**,***,**** P < 0.05, 0.01, 0.001 and 0.0001, respectively.
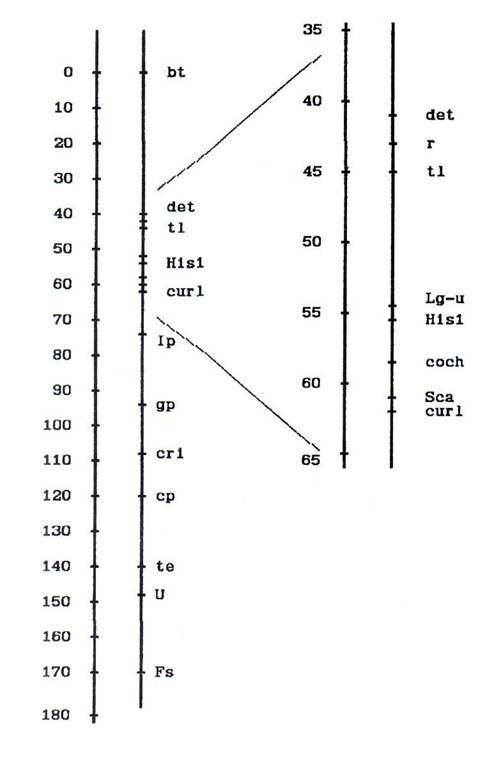
Fig. 1. Map of pea linkage group 5.
We conclude that, in contrast to the last version of the pea genetic map (10, 11), genes det and curl are located on the different ends of the r – tl segment and the whole segment r – tl – His1 – coch – Sca – curl is inverted in relation to other markers belonging to this group.
In two other crosses, the positions of genes cri, gp, cp, Fs and U were estimated (see Table 4). Our EMS-induced line SGE-182 displays a crispa phenotype due to a mutation which showed allelism with gene cri in a cross with line NGB-1297 (cri). In the cross NGB-1238 x SGE-182 significant evidence of linkage between r – tl and gp was obtained. The results given in Table 4a indicate the following gene order:
![]()
These results are in accordance with those of Murfet (4).
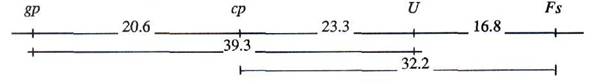
Table 4b and the next scheme show data for genes gp, cp, Fs and U obtained in cross NGB-1238 x SGE-185.
According to data given above we propose a new version of the pea linkage group 5 map as shown in Fig. 1.
Acknowledgements, We thank Dr. S. Blixt for providing seeds of the lines NGB-1238, NGB-1297 and NGB-5558, Dr. W.K. Swiecicki for providing mutant line Wt-11745 and Dr. N. Weeden for useful comments on the manuscript. This work was partially supported by the Russian State Program "Frontiers in Genetics".
1. Folkeson, D. 1988. PNL 20:10-13.
2. Folkeson, D. 1990. Ph.D. Thesis. Department of Genetics, University of Lund, Sweden, 1-33.
3. Marx, G.A. 1969. PNL 1:20-21.
4. Murfet, I.C. 1990. PNL 22:38-40.
5.
Rozov,
S.M., Bogdanova, V.S. and Berdnikov, V.A. 1986. Genetica (Russia)
8:2159-2166.
6. Smirnova, O.G., Rozov, S.M. and Berdnikov, V.A. 1989. PNL 21:63-65.
7. Smirnova, O.G., Rozov, S.M. and Berdnikov, V.A. 1989. PNL 21:66-68.
8. Smirnova, O.G. 1990. PNL 22:52-54.
9. Smirnova, O.G., Rozov, S.M., Kosterin, O.E. and Berdnikov, V.A. 1992. Plant Sci. 82:1-13.
10.
Weeden,
N.F., Ambrose, M. and Swiecicki, W.K. 1991. Pisum Genet.
23: cover.
11.
Weeden,
N.F. and Wolko, B. 1990. In: Genetic Maps, Ed. S. O'Brien, Cold
Spring Harbor Laboratory Press, Cold Spring Harbor, New York, pp. 6106-6112.
12. Wellensiek, S.J. 1962. Genetica (Netherlands) 33:145-153.