|
Pisum Genetics |
Volume 25 |
1993 |
Research Reports |
pages 33-39 |
Further evidence that Td is located on pea linkage group III
|
Polans N.O. |
Department of Biological Sciences, Northern Illinois University, DeKalb , IL 60115 , USA |
Lamprecht (3, 4) reported linkage between Td, a genetic locus that conditions leaflet dentation in pea, and three linkage group IV markers, fa, z and n. Marx (6), however, found no evidence of linkage between Td and either z or was (another group IV marker closely associated with z) upon performing an F2 analysis of a different cross. Instead, he demonstrated linkage between Td and b, a linkage group III marker, noting that a loose association between Td and b had been indicated by Lamprecht's original data as well. More recently, Grajal-Martin and Muehlbauer (2) used two independent crosses to show that Td is linked with Lap-1, a linkage group III isozyme marker, establishing a composite Td—Lap-1 recombination value of approximately 23%. Given that Lap-1 and b are closely linked (9), this figure is similar to the approximately 15% (17.1% and 14.2%) recombination value Marx (6) determined for Td and b.
In the present study, I have obtained additional evidence supporting the assignment of Td to linkage group III. An evaluation of the F2 progeny of two independent crosses, A73-91 x A778-26-6 and A1078-234 x 82-14n, reveals that Td is linked with st (the linkage group III gene for reduced stipules) in both crosses with recombination values of 20.2% and 22.0%, respectively (see Table 1), using the LINKAGE-1 computer program (8). The plant materials, all obtained originally from G.A. Marx and N.F. Weeden, have been characterized as either Td (A778-26-6 and 82-14n) or Td (A73-91 and A1078-234); A778-26-6 was one of the parental lines used in the Grajal-Martin and Muehlbauer study. Both crosses involved standard marker lines (A73-91 and A1078-234) and produced fully fertile hybrids.
The A1078-234 x 82-14n cross also segregated for three other linkage group III markers, Pea2 (an RFLP marker corresponding to a light-regulated gene), Vc-5 (an RFLP marker corresponding to a member of the vicilin multigene family) and Lap-1 (7). Pairwise comparisons among these loci reveal that Vc-5 and Lap-1 are both linked with Td as well, displaying recombination values of 27.6% and 22.2%, respectively. Pea2 showed linkage with Vc-5 (22.6%) and a very loose, perhaps questionable, linkage with st (44.9%). The 22.2% recombination value for Td and Lap-1 found in this cross is very close to the 23% figure reported by Grajal-Martin and Muehlbauer (2).
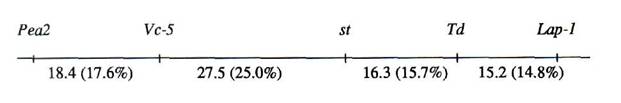
When 46 F2 progeny from the A1078-234 x 82-14n cross were analysed using the MAPMAKER multipoint linkage package (5), the integrated map shown in Fig. 1 was generated based in part on the LOD scores summarised in Table 2. The LOD scores reveal five particularly strong linkage relationships which characterise Fig. 1 and which are generally consistent with the broad pairwise relationships established in Table 1. The data clearly indicate that Td is closely associated with Lap-1 and st. They further link st with Vc-5, and Vc-5 strongly with Pea2. The most reasonable conclusion to draw from these findings corroborates the suggestion by Marx (6) and Grajal-Martin and Muehlbauer (2) that Td is located on pea linkage group III.
Table 1. Joint segregation analyses for linkage group III genetic marker loci.
|
Loci |
Number of F2 progeny in each genotypic class a |
n |
c2 |
P |
Recomb. value (%) | ||||||||
| 11,11 | 11,12 |
11,22 |
12,11 |
12,12 |
12,22 |
22,11 |
22,12 |
22,22 |
|||||
|
A1078-234 x 82-14ne |
|||||||||||||
|
Pea2, Vc-5 b |
14 |
0 |
0 |
2 |
16 |
8 |
0 |
11 |
1 |
52 |
47.1 |
<<0.001 |
22.6±4.8 |
|
Pea2, st c |
12 |
|
2 |
17 |
|
10 |
12 |
|
0 |
53 |
7.3 |
<0.05 |
44.9+8.3 |
|
Vc-5, st c |
21 |
|
4 |
37 |
|
4 |
9 |
|
14 |
89 |
22.1 |
<<0.001 |
25.6±5.2 |
|
Vc-5, Td c |
22 |
|
3 |
37 |
|
4 |
11 |
|
11 |
88 |
15.8 |
<0.001 |
27.6±5.5 |
|
Vc-5, Lap-1 b |
5 |
11 |
8 |
17 |
24 |
0 |
1 |
8 |
14 |
88 |
32.6 |
<<0.001 |
38.2±4.9 |
|
st, Td d |
62 |
|
6 |
|
|
|
11 |
|
12 |
91 |
20.4 |
<<0.001 |
22.0±9.9 |
|
Lap-1, st c |
22 |
|
2 |
38 |
|
8 |
10 |
|
14 |
94 |
18.9 |
<<0.001 |
24.8+5.0 |
|
Lap-1, Td c |
23 |
|
0 |
37 |
|
6 |
12 |
|
12 |
90 |
20.2 |
<<0.001 |
22.2±4.9 |
|
A73-91 x A778-26-6e |
|||||||||||||
| st, Td d | 30 |
9 |
2 |
12 | 53 | 16.9 | <<0.001 | 20.2±13.1 | |||||
a Genotypic designations: 11 = 82-14n or A778-26-6 homozygotes, 22 = A1078-234 or A73-91 homozygotes, and 12 = heterozygotes (for Vc-5, 1 and 2 represent haplotypes; for st and Td, (masked) heterozygotes are scored as 11).
b 1:2:1:2:4:2:1:2:1 expected ratio.
c 3:1:6:2:3:1 expected ratio.
d 9:3:3:1 expected ratio.
e Reciprocal cross.
f Calculated using the LINKAGE-1 computer program (8); pairwise comparisons with P > 0.05 or a recombination value = 50% are not listed
Table 2. Pairwise LOD scores for linkage group III genetic marker loci calculated by applying the MAPMAKER computer program (5) to 46 F2 progeny from the reciprocal cross A1078-234 x 82-14n.
|
Loci |
LOD scores |
|
Pea2, Vc-5 |
4.28* |
|
Pea2, st |
0.02 |
|
Pea2, Td |
0.00 |
|
Pea2, Lap-1 |
0.00 |
|
Vc-5, st |
2.15* |
|
Vc-5, Td |
0.56 |
|
Vc-5, Lap-1 |
0.60 |
|
st, Td |
2.75* |
|
st, Lap-1 |
3.01* |
|
Td, Lap-1 |
2.83* |
* Log of the odds ratios (LOD scores) between 2.00 and 5.00 indicate that the likelihood of linkage by a stated recombinant fraction is between 100 and 100,000 times greater than the likelihood of no linkage, respectively.
Fig. 1. Linkage associations for five linkage group III genetic loci. Recombination values (in parentheses) were determined using the MAPMAKER multipoint maximum likelihood algorithms (5). Map distances in cM were calculated using the Kosambi mapping function.
Grajal-Martin and Muehlbauer (2) offer two interesting explanations for the discrepancy between the original findings of Lamprecht (3, 4) and the findings of subsequent investigators. They reason that either 1) there are two Td genes, one located on linkage group III and the other located on linkage group IV, or 2) genomic rearrangements have resulted in a single Td gene being shifted between the two linkage groups of different pea lines. The first explanation would seem to be the less likely of the two given the precise characterisation of the Td phenotype by Marx (2, 6, and pers. comm.). Furthermore, the segregation and assortment ratios of a duplicate gene system which would accommodate all the data presented in these studies may require more elaborate and restrictive conditions than parsimony allows. By contrast, genomic rearrangements in pea appear to be fairly common, as evidenced most recently by the publication of a pea RFLP map (1) in which genetic markers were found to exist in several different linkage arrangements depending on the cross selected. Given the convincing presentations of all the Td data sets described in these studies, the latter explanation may provide the most appropriate hypothesis.
Acknowledgements. I thank the Department of Biological Sciences and Plant Molecular Biology Centre at Northern Illinois University for financial support for this study.
1.
Ellis, T.H.N., Turner, L., Hellens,
R.P., Lee, D., Harker, C.L., Enard, C.,
Domoney, C. and Davies, D.R. 1992. Genetics 130:649-663.
2. Grajal-Martin, M.J. and Muehlbauer, F.J. 1992. Pisum Genet. 24:54-55.
3. Lamprecht, H. 1945. Hereditas 31:347-382.
4. Lamprecht, H. 1948. Agri Hort. Genet. 6:10-48.
5.
Lander, E.S., Green, P., Abrahamson, J.,
Barlow, A., Daly, M.J., Lincoln, S.E.
and Newburg, L. 1987. Genomics 1:174-181.
6. Marx,G.A. 1987. Pisum Newsl. 19:38-39.
7. Polans, N.O. and Folta, K.M. 1992. Pisum Genet. 24:79-81.
8. Suiter, K.A., Wendel, J.F. and Case, J.S. 1983. J. Hered. 74:203-204.
9.
Weeden, N.F., Ambrose, M. and Swiecicki,
W.K. 1991. Pisum Genet.
23:cover.