Pisum Genetics   

Volume 25

1993

Research Reports

pages 27-31

Mapping of the new mutation blb and the problem of integrity of linkage group I

Kosterin, O.E. and

Rozov, S.M.

Institute of Cytology and Genetics

Novosibirsk 630090, Russia

A new recessive mutant, designated blb (bulbosus), is described and mapped on linkage group I.

The blb mutation was induced in line SGE following treatment with 0.15%  EMS (ethylmethanesulphonate). The original mutant line was registered as SGE80. The initial line SGE was derived by V.A. Berdnikov from crosses among lines VIR6135 (from Greece), VIR320 (from Palestine, Pisum sativum syriacum), and an original ultra rapid line, Sprint-1.

The blb mutation transforms the shape of leaflets and stipules. The leaflets of homozygous blb plants are rather narrow, especially at lower nodes, and are wedge-shaped so that the maximal width of a leaflet is attained distally from the middle of its length (Fig. 1). At the first several nodes, the leaflet edges are rolled inside. The stipules are narrowed and, as a rule, do not overlap each other. The pods are narrowed, especially in the base, and seed productivity is reduced. In seedlings of the original mutant line SGE80 the stem is slightly thickened just above the first scale leaf. However, in the F2 progenies of three crosses involving this mutant (see below) this feature was much more pronounced. The seedlings homozygous for blb appeared to be considerably delayed in their growth, and their stems within the first 2-3 nodes were shortened and extremely inflated - up to 1 cm wide (Fig. 1). The name bulbosus was given to the mutant due to this unusual swelling of the stem. It was our impression that the apex ceased to grow and all the nutrients were directed into stem inflation. In the F2 progeny of cross SGE80 x WL1238, which was grown in a greenhouse, the apical buds of homozygous blb plants usually died and several lateral branches grew from basal nodes. In the F2 of cross VIR3971 x SGE80, which was planted in the field, mutant seedlings ceased growth for several days and then produced a normal shoot from the apical bud. In this cross the mutant plants usually produced no basal branches, while their counterparts with a normal phenotype exhibited vigorous basal branching. The situation was therefore opposite to that observed in the previous cross. The degree of stem inflation in mutant seedlings was variable and some blb homozygotes had stems only slightly thickened, as in the original mutant line SGE80. The modified leaflet shape was, however, an invariable character of blb homozygotes.

The F2 plants of cross SGE80 x WL1238 were tested for histone H1 electrophoretic spectrum, as described in (1, 2). The parental lines have different allelic variants of H1 subtype 7: SGE80 has allele His72 and WL1238 has allele His73. A significant linkage of 20 cM was detected between loci blb and His7 (Table 1) suggesting that blb belongs to linkage group I. Unfortunately, no other neighbouring marker genes were involved in this cross.


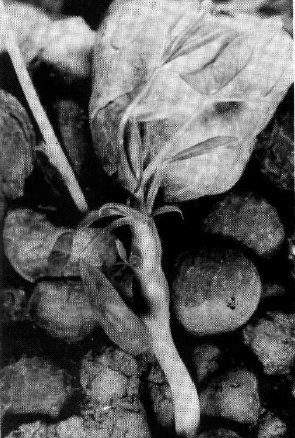
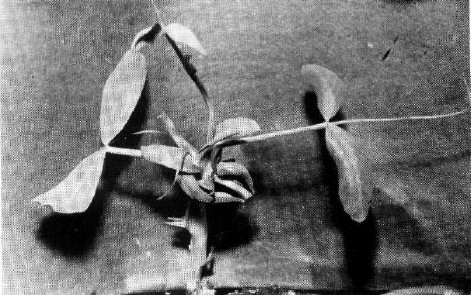
Figs la and b. Seedlings homozygous for blb.

Table 1. Joint segregation of genes His7 and blb in the F2 of cross SGE80 x WL1238.


His73

His73 / His72

His72

Blb

15

37

7

blb

1

5

11

Recomb. Fract = 19.91%; SE = 5.04%; Linkage c2 = 20.60; P = 0.00003.

In order to map gene blb, two other crosses were carried out: VIR3971 x SGE80 and SGE80 x OK7. Line SGE80 has alleles blb, His(2-6)1221 [this is the cluster of genes encoding histone H1 subtypes 2-6 (1, 2)], His72, A, Dw, and i; line VIR3971 has alleles Blb, His(2-6)1111, His71, A, Dco, and I; line OK7 (derived by O. Kosterin from Weibullsholm lines WL1393, WL1688, and WL102) has alleles Blb, His(2-6)1121, His73, a, Dco, and I. In both crosses, the F1 hybrids were vigorous and exhibited full fertility of both pollen and ovules. We grew F2 progenies comprising 663 plants of the former cross and 123 plants of the latter. F2 segregation data are presented in Tables 2 and 3.

The recombination frequencies inferred from the cross VIR3971 x SGE80 indicate the following arrangement of genes:

                            His(2-6)___________ His7                                blb

____ 28.1 ± 1.5                  17.6 ± 1.6         

                                   36.6 ± 2.2____________ cM

The distance between His(2-6) and His7 corresponds well to that obtained in several other crosses (2, 3, and unpub.).

The data from cross SGE80 x OK7 indicate the following map segment:

His(2-6)         a                                        His7                              blb

          13.6 ± 3.3           33.0 ± 4.0                              18.7 ± 3.8        

_____________ 35.6 ± 4.0                        

                                 33.8 ± 7.9                                     

  _________________ 36.7 ± 5.2                                                             cM

This map shows a good correspondence to the previous one, but, for an unknown reason, the distance His(2-6) – a is much greater than the 5-7 cM observed in numerous other crosses (1, 2, and unpub.).

Table 2. Joint segregation data obtained from the F2 of cross VIR 3971 x SGE80.

Gene A

Gene B

Phenotype1

Recomb.
Fract. (%)
2

SE

A/B

A/h

A/b

h/B    h/h    h/b

a/B

a/h

a/b

His (2-6)

His7

97

63

11

81     188    52

23

59

89

28.12

1.52***

blb

His7

198

268

56


3

42

96

17.63

1.61***

blb

His (2-6)

154

256

112


17

65

59

36.59

2.23***

blb

d

399


123

(repulsion)

109


32

49.60

2.93

blb

i

346


176

(coupling)

95


46

51.80

2.97

d

His (2-6)

125

248

135


46

73

36

53.07

2.37

d

His7

118

227

163


34

83

38

52.34

2.37

d

i

342


166

(repulsion)

99


56

51.61

2.86

i

His (2-6)

103

224

114


68

97

57

52.74

2.37

i

His7

125

209

107


76

101

45

54.43

2.36

1 In the case of dominant genes, the letters A and B stand for the dominant alleles and the letters a and b for the recessive ones. Where the second gene is codominant, capital A stands for the dominant allele of the first gene and capital B for an allele of the second gene which is in coupling with A. Where both genes are codominant, the capital letter stands for an allele coming from the first parent, h stands for heterozygotes.

2 The recombination fractions and their standard errors were estimated by Fisher's method of maximum likelihood. In this and the following table ** and *** indicate that the recombination values differ from 50% by more than two and three times the standard errors, respectively.

Note: the plants also segregated for genes fl (group 6) and His1 (group 5); these genes segregated independently of each other and of the other genes involved.

Ta

Table 3. Joint segregation data obtained from the F2 of cross SGE80 x OK7.

Gene A

Gene B

Phenotype1

Recomb.
Fract. (%)1

SE

A/B

A/h

A/b

h/B    h/h      h/b

a/B

a/h

a/b

a

His(2-6)

28

47

8

1

8

31

13.65

3.29***

His7

His(2-6)

6

15

4

21     27      14

2

13

21

35.64

4.02***

blb

His(2-6)

36

42

20

3

13

9

36.69

5.17**

a

His7

21

45

17

4

17

19

32.96

4.98***

a

blb

62

21

(repulsion)

36

4

33.79

7.87**

blb

His7

36

52

10

0

10

15

18.68

3.84***

blb

d 2

44

17

(repulsion)

17

4

43.04

8.90

d 2

His7

17

31

13

4

14

3

49.39

6.76

d 2

His(2-6)

22

34

5

6

12

3

44.57

6.69

1 See footnotes for Table 2.

2 Joint segregations involving d were analysed only among A plants.

Earlier (3) we demonstrated the absence of linkage between genes His7 and d. Linkage between these genes should be detected if the published maps of pea linkage group I are correct (the expected distance varies from 1-20 cM depending on the particular map version). Moreover, we found (3) that placement of genes a and d in the same linkage group was based on ambiguous data concerning their direct segregation and very questionable data concerning segregation of gene au. The segregation data from crosses (Tables 2 and 3) show no evidence or indication of linkage between d and either His(2-6), His7, or blb. This result extends by some 17-19 cM the length of the map region in the upper section of group I where linkage with d cannot be detected. Likewise, there was no indication of linkage between either His(2-6), His7, blb or d and standard marker i which is placed in the lower section of group I in existing linkage maps. Thus our present data further support the previous conclusion of Kosterin (2, 3) that the d - i linkage segment is not on the same chromosome as the a—His7 linkage group. Gene blb now appears to be the most distal (in the direction of gene lf from gene a) marker among the so far known loci of group I. There is, therefore, an urgent need to obtain additional linkage data on the d - i segment of the pea genome.

1.                  Belyaev, A.I., and Berdnikov, V.A. 1981. Genetika (USSR) 17:498-504.

2.           Kosterin, O.E. 1992. Pisum Genetics 24:56-59.

3.           Kosterin, O.E. 1993. Pisum Genetics 25:23-26.