PNL Volume 21 1989 RESEARCH
REPORTS
73
A NEW GENE CRISPOID
(crd) ON CHROMOSOME 1
Swiecicki, W. K.
Plant Breeding Station,
Wiatrowo
62100 Wagrowiec,
Poland
In
experiments on induced mutations (1) a mutant of crispoid type was
selected after seed treatment of line
Wt 3527 by 0.014% NEU and included in the Wiatrowo pea gene bank in 1981
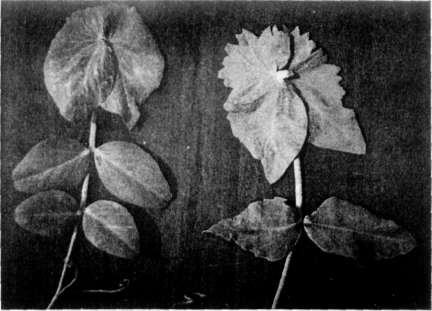
under catalogue number Wt 11300. Crispoid pea plants are
characterized by a bigger and more waved leaf surface than normal and the
stipules are toothed at the base (Fig. 1). Some connection with the cerosa and
wilty phenotypes could also be seen. Locus identity tests for
crispoid (Wt 11300) with crispa (Wt 11297, cri),
crispi folius fertilis
(Wt 16118, crif) and curled (Wt 15855, curl) showed
that all of these phenotypes
are controlled by different loci. A good monohybrid segregtion was obtained in the
F2 population of cross Wt 3527 x Wt 11300 (153 normal: 48 mutant plants;
X2 = 0.13). Therefore the symbol crd for crispoid is
suggested.
To
locate the new gene, several crosses were made with tester lines. Monogenic recessive inheritance of
crd was confirmed in these F2 populations (e.g. Table 1A) . Linkage
between crd and the a locus was found in the F2 of crosses Wt 11300 x Wt
11288 (recomb. fract. 21.2) and Wt 11300 x Wt 11238 (recomb. fract. 20.4,
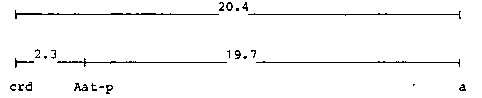
Table IB). The latter cross also revealed tight linkage between crd
and the isozyme locus Aat-p (recomb. fract. 2.3) but the recombination
fraction of 35.7 ± 8.7 for crd and the d locus does not differ
significatnly from that expected with free recombination (Table IB). These results
suggest that crd is located on chromosome 1 close to Aat-p,
probably between Aat-p and Est-3 (2). The latter locus should be utilised in more
detailed mapping studies. The following linkage map is tentatively
suggested.
I
acknowledge the help of Dr. Bogdan Wolko in separating genotypes or the Aat-p
locus.
1.
Swiecicki, W. K. 1984. PNL 16:84-86.
2.
Weeden, N. F. 1985. In: The Pea Crop. A Basis for Improvement. Eds. P. D. Hebblethwaite, M. C. Heath, and
T. C. K. Dawkins, Butterworths,
London, pp. 55-66.