LIGHT/DARK CHANGES IN
CQ2 LEVELS IN THE POD SPACE OF GREEN, PURPLE AND YELLOW
PODDED LINES OF PISUM SATIVUM L.
Donkin, Maria and
Department: of Biological
Sciences
David N. Price
Plymouth Polytechnic, Plymouth, Devon,
UK
Pea pods act as a protective
envelope, producing a partially controlled microenvironment in which the
seeds develop. One variable in this environment is CO2
concentration, which in turn is affected by light flux, pod temperature
and stage of development. Variations in C02 within the pod
space could have physiological and metabolic implications for the seed and
inner pod layers, particularly in relation to carbon economy. Even in a
single line, cv. Greenfeast, C02 levels vary from about 0.15%
in young pods in the light to over 1.5% in older pods in the dark (2).
Given the considerable range of pod types, this variation is likely to be
much greater in Pisum as a whole. We have extended the study of
Flinn et al. (2) to include a limited varietal comparison, measuring fast
light/dark changes at different stages of development in green, purple and
yellow podded types.
Four lines were used in this
study; JI 141 (green pods); JI
73 (yellow pods); JI 60[P] (purple pods) and JI 60[G] (green pods). JI
60[G] was formed by reversion of the purple line JI 60[P] and therefore
these two lines are near-isogenic. Pod space C02 was measured
using the Infra Red Gas Analyzer technique of Atkins and Pate (1) using a
sample volume of 100 pi. Pods were illuminated for short term experiments
with a Schott KL1500 lamp with two fibre optic probes. Changes in
temperature inside the pod were checked during illumination with a
thermocouple linked to an electronic thermometer and it was found that
there was no significant difference in temperature change between the pod
types.
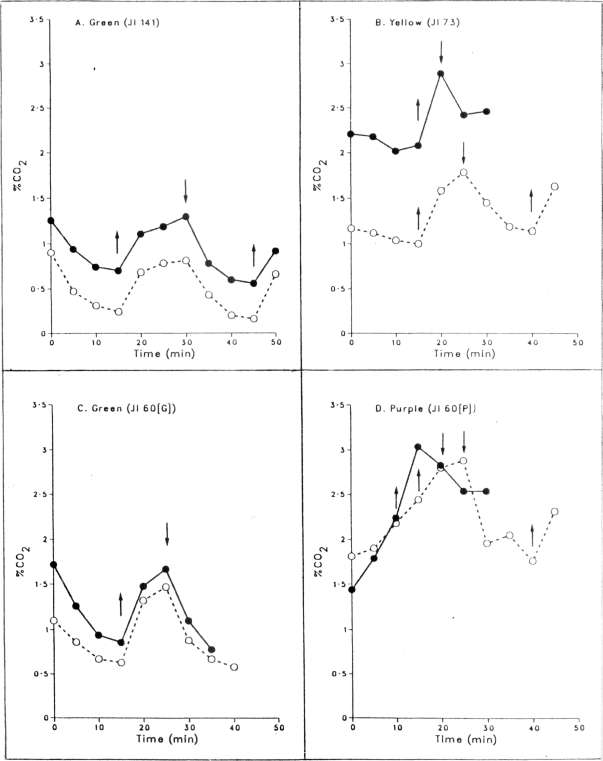
The effect of short-time light
on/off experiments is shown in Fig. 1 for the four pod types. The green
and yellow pods exhibited a
pattern characterized by a C02 decrease in the light followed
by an increase in the dark. This pattern was repeatable for up to 3 cycles
on a single pod. Stage 2 pods had generally lower C02 levels
than stage 3 pods. Yellow and purple pods had higher C02 levels
than either of the green pods. The purple pods appear to show the most
aberrant behavior with an initial increase in C02 level in the
light followed by a further increase in the dark period to a maximum of
3.0%. Responses to the light/dark switching were rapid; in green pods they
occurred in as little as 2 minutes.
From the data shown here it would
seem that ' the younger actively
growing seeds (in stage 2 pods) are mainly exposed to lower levels
of C02, particularly during very bright conditions. This has
been confirmed by field measurements. The level in such pods may fall to
0.1-0.2% cW while older stage 3 pods could have a C02 level
fluctuating around 0.7-1.0%. It has been shown that plants grown in
C02 levels of 0.1-0 S% have decreased RUBPcarboxylase/oxygenase
and glycolic acid oxidase activity (3) and this may have
implications for pod photosynthetic and photorespiratory activity,
especially in older stages.
The very high levels of
C02 found in the purple pods, and the inability of these pods
to reduce C02 levels in the light, may indicate a lower
photosynthetic activity due to poor light penetration through the pod wall
(personal observation). This seems to be reflected in the lower seed dry
weight found for purple pods compared with a green podded
variety in