66 PNL Volume 21 1989 RESEARCH REPORTS
TRYPSIN INHIBITOR GENES ARE LINKED TO R AND Tl
Smirnova, O.G., S. M. Rozov, and V. A.Berdnikov
Institute of Cytology and Genetics, Academy of Sciences
Siberian Division, Novosibirsk, USSR
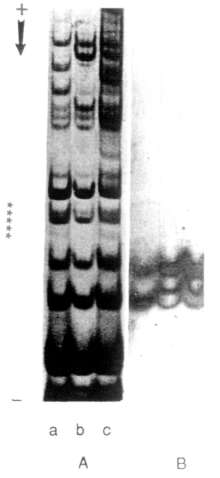
Pea seed trypsin inhibitors are poorly studied, possibly due to their amount being less than in other legumes. Using chromogenic substrates for inhibitor identification, inhibitors were proved to be heterogenous in any single genotype of pea (1,7). A wide range of variation in inhibitor activity was shown among cultivars (4,6). After comparison of different inhibitor extraction methods (2), we have chosen a 5% perchloric acid extraction of seed flour followed by acetic acid-urea gel electrophoresis (Fig. 1). Trypsin inhibitor bands were determined by the gelatine replica method (3). A single extraction was shown to be enough for almost complete removal of perchloric acid extracted proteins.
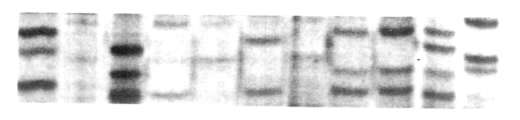
An analysis of 100 samples from the collection of the N. I. Vavilov Institute of Plant Industry (USSR) enabled us to observe more than ten types of inhibitor electrophoretic patterns. They differ in the number of fractions and in their relative amounts (Fig. 2). It should be noted that some of the bands with trypsin inhibitor activity also possess chimotryp-sin inhibitor activity.
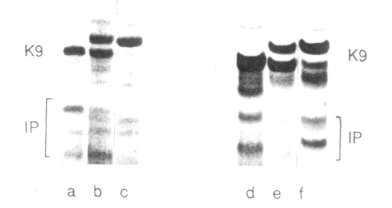
To study the inheritance of the trypsin inhibitor genes, we crossed line WIR 2524 (ssp. elatius) with the tester-line NGB 1238. The former lias five electrophoretic bands with trypsin inhibitor activity while the latter possesses only two subtle ones (Fig. 3). The segregation of band patterns observed in F2 progeny is in agreement with the joint inheritance of all trypsin inhibitor components (Table 1). The corresponding gene complex was designated IP (Inhibitor of Proteases). The IP complex is shown to be located in the same linkage group as R and Tl (Table 2A), 21.3 ± 2.7 map units from gene Sa-K9 (5) and at 34.8 ± 3.1 map units from gene tl. Location of the IP genes was also studied in the cross of our laboratory line 'Sprint' (alleles R, Tl, His-lS, Sa-K9F, IPF) with the tester-line NGB 1018 (alleles r, tl, His-1F, Sa-K9S, IPS). The results of the segregation are shown in Table 2B. The genetic distance between the IP and Sa-K9 genes appeared to be different in the two crosses examined: 21.3 ±2.7 and 15.3 ±2.5 map units, respectively. This difference may be accounted for by the differences in genetic background between the subspecies being used. The genetic map of the r-tl chromosome segment based on data presented in this and the previous paper (5) is as tollows:

1. Ghavan, J. K., and J. Hejgaard. 1981. J. Sci. Food Agric. 32:857-862.
2. Gofman, J. J., and I. M. Vaisblay. 1975. Prikladnaja Biochimija i Mikrobiologija. 11:777-783 (in Russian).