A GENERAL DESCRIPTION OF POD DEVELOPMENT IN PISUM SATIVUM
Price, D.N. and J.E. Hayward Plymouth Polytechnic, U. K.
As with other systems, the usual approach adopted in studying pea
fruit development is to investigate the process in a particular line,
minimizing variation and building up a detailed description of that line.
Only rarely do workers attempt to consider more than one or two varieties.
From these studies an extrapolation is made to describe the general fea-
tures of the species. No serious criticism of such an approach is implied
here and often it is the only one feasible. However, as has been often
pointed out, especially by geneticists, Pisum is such a diverse "species"
that no one line can be taken as typical. In the study partly described
here we have attempted to accomodate this diversity.
We surveyed changes in pod components in a wide range of genotypes in
order to gain an appreciation of the variation and also to make a sensible
selection of lines for more detailed study. However, in processing the
results it became clear that by pooling them they could be used to provide
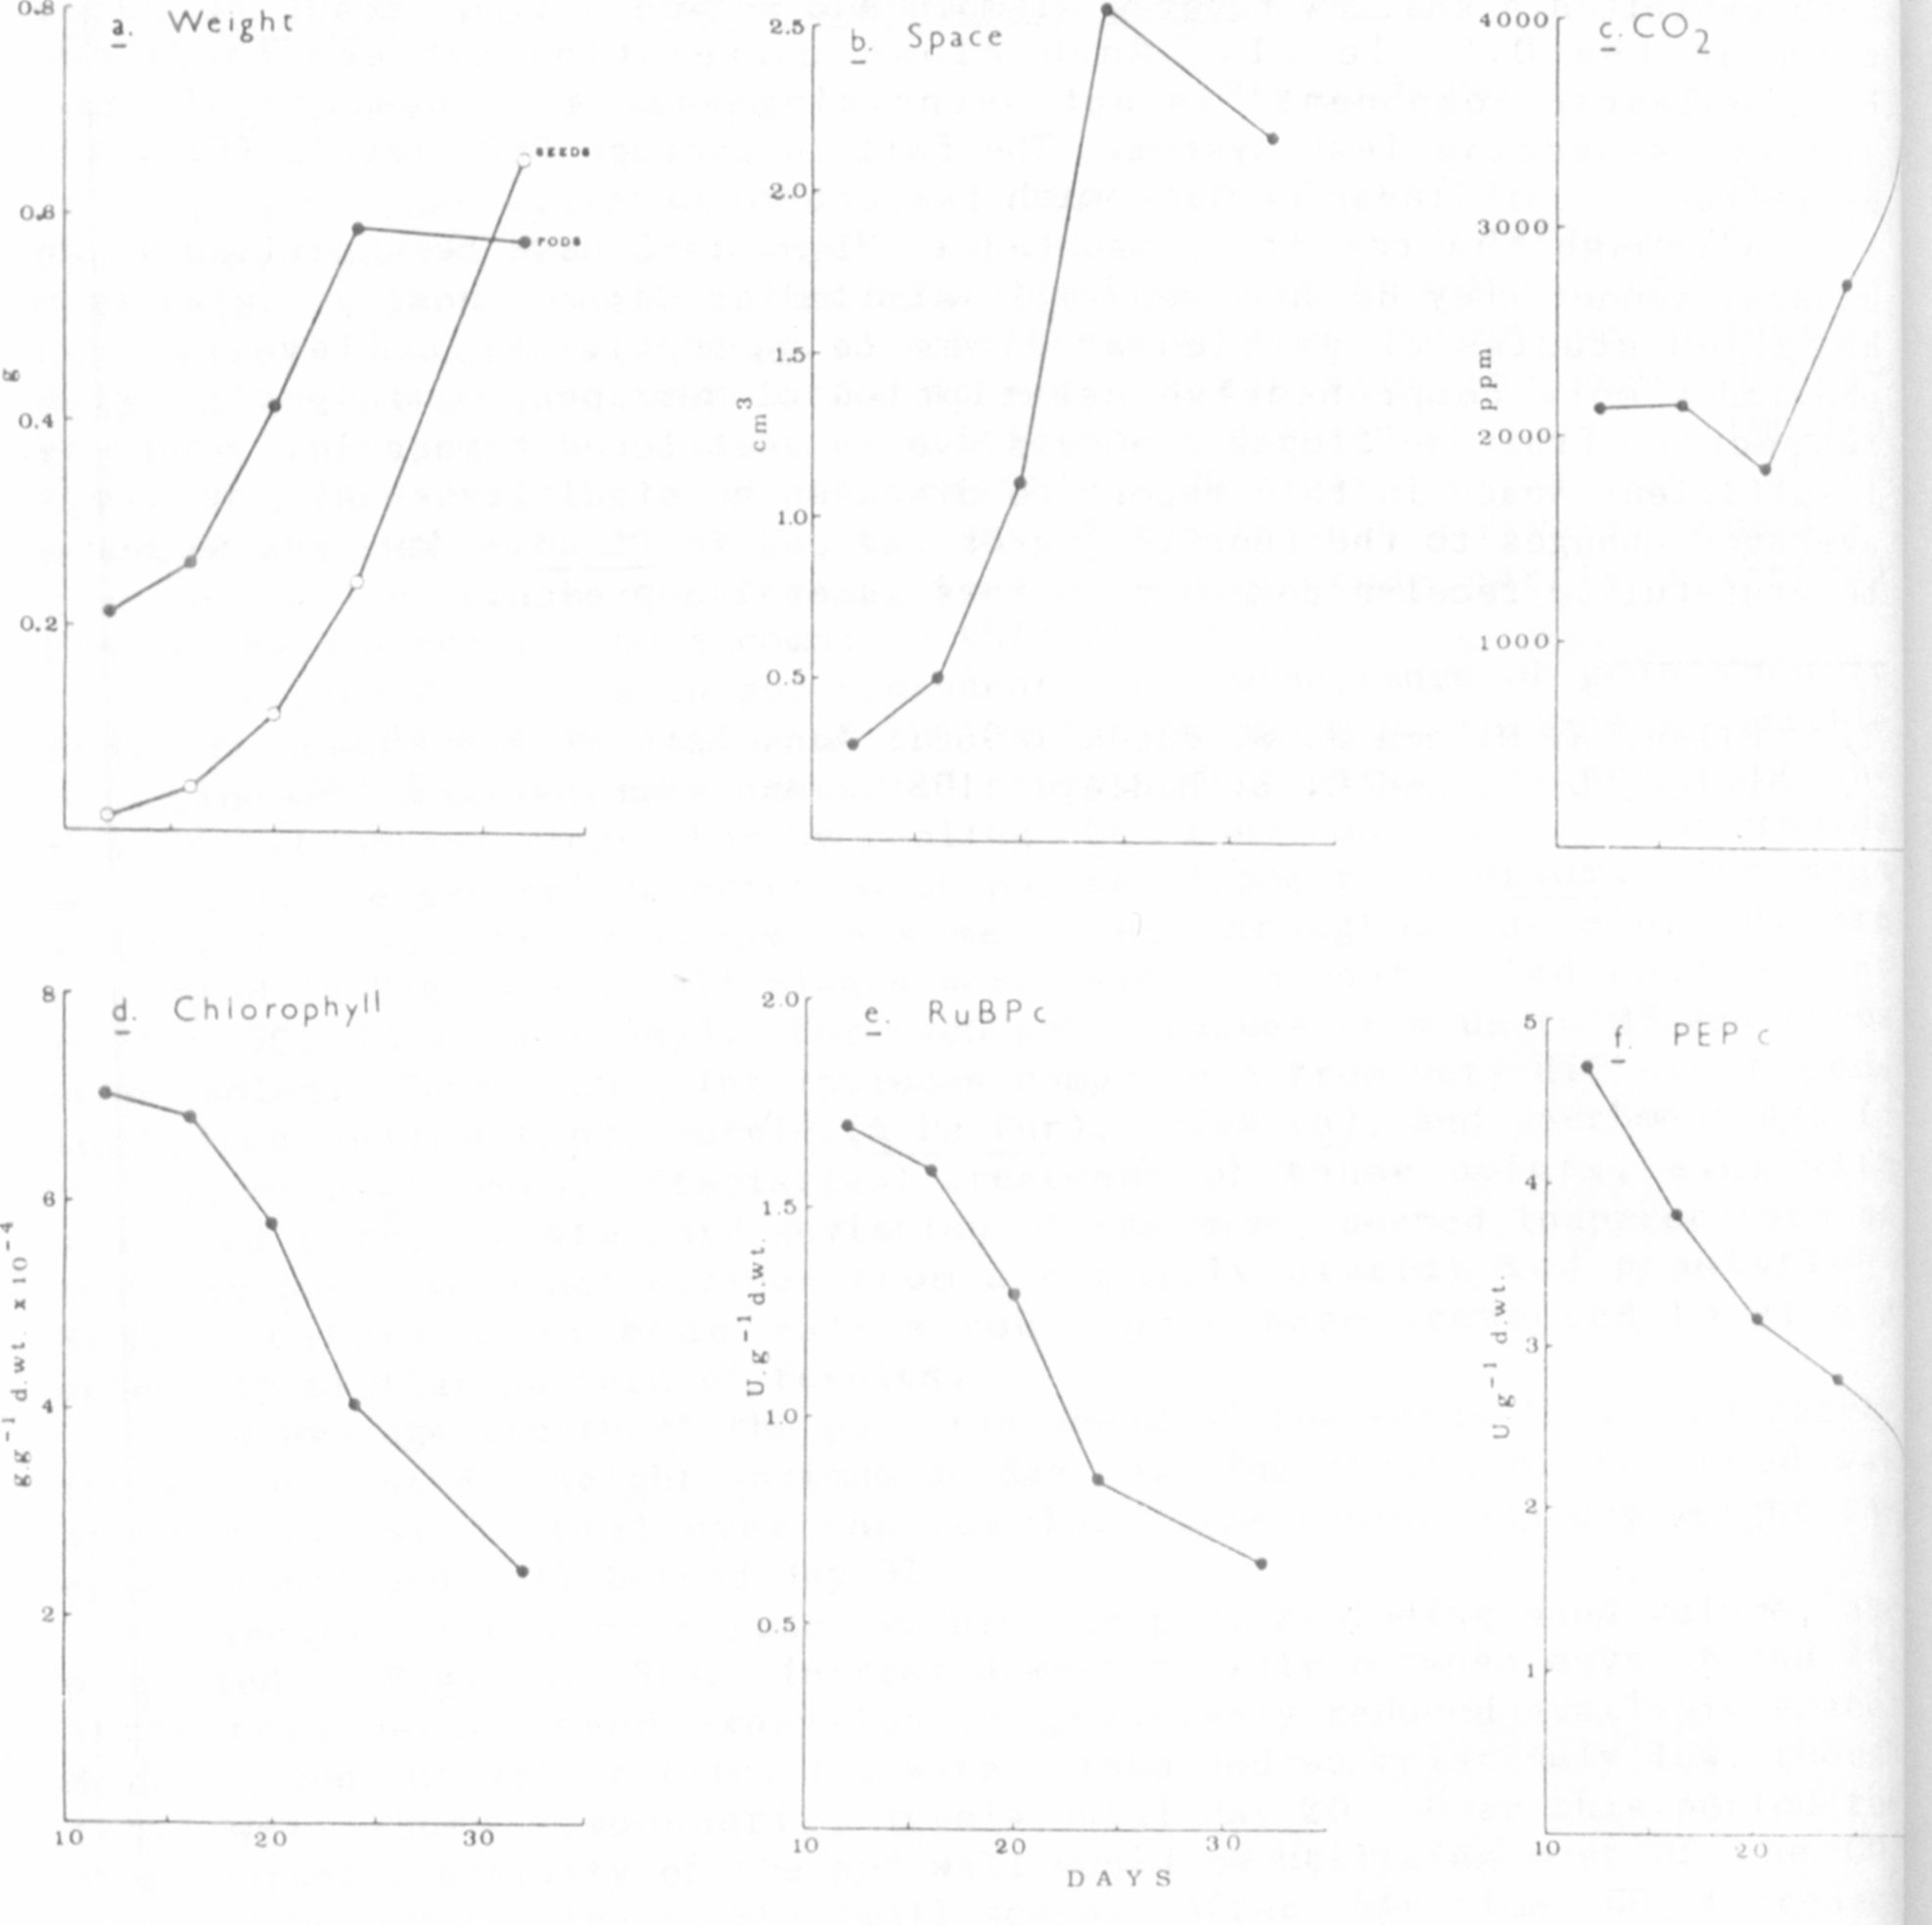
an alternative general description of pod development in Pisum. The mean
values for six fruit parameters measured throughout development are
presented in Fig. l a-f. All plants were held in a controlled environment
room (15C, 16h/15klx day). For each point values from up to 35 genotypes
were pooled. Thus each point includes components from very different pods
including yellow (gp), purple (A Pu Pur), thick (n), and parchmentless (p
V, P v, or p v) types. Statistical treatment of these points, e.g. with
standard error or standard deviat ion of the mean, seemed inappropriate as
they obviously were not derived from a normally distributed population,
Median rather than mean values could have been presented to give a
generally similar pattern of results.
The average growth of the pods ran ahead of the seeds (Fig. la) reach-
ing an apparent dry weight maximum at day 24. The growth of the seed was
apparently exponential over the complete time course and dry weight in-
crease continued well beyond day 32.
Changes in the mean space within the pod, excluding seed volume, are
presented in Fig. lb. Space increased most rapidly between days 16 and 24,
After this period seed expansion progressively reduced available space.
Mean CO2 concentrations (Fig. lc) were maintained at relatively low, though
still well above atmospheric, levels until day 20. Over this period the
photosynthetic activity of the pod wall would be utilizing most of the CO2
produced by respiration in the small seeds. After this time, CO increased
dramatically, doubling between days 16 and 32. This reflected both in-
creased respiration in the growing seeds and the decline in the
concentration of systems associated with GO utilization in the aging pods
(Figs. l d-f).
The average changes in pod components presented in Figs. 1d—1f ex-|
hibited similar patterns of decline. Up until day 24 this can largely be
explained by a diluting effect as the pods grew. However, it continued
even when pod growth ceased and at least over the 24- to 32-day phase must
have been associated with pod senescence. There was a particular
similarity in the decline of RuBPc (Fig. 1e) and chlorophyll (Fig. ld).