68 PNL Volume 16 1984
RESEARCH REPORTS
SEED STORAGE PROTEINS OP CHROMOSOME MUTANTS IN PISUM
Rao, R. and S. Grillo Plant Breeding Institute
University of Naples, Portici, Italy
In Pisum the electrophoretic analysis of seed proteins has been
very useful to investigate genetic variations both in different ecotypes
and in induced mutants (1).
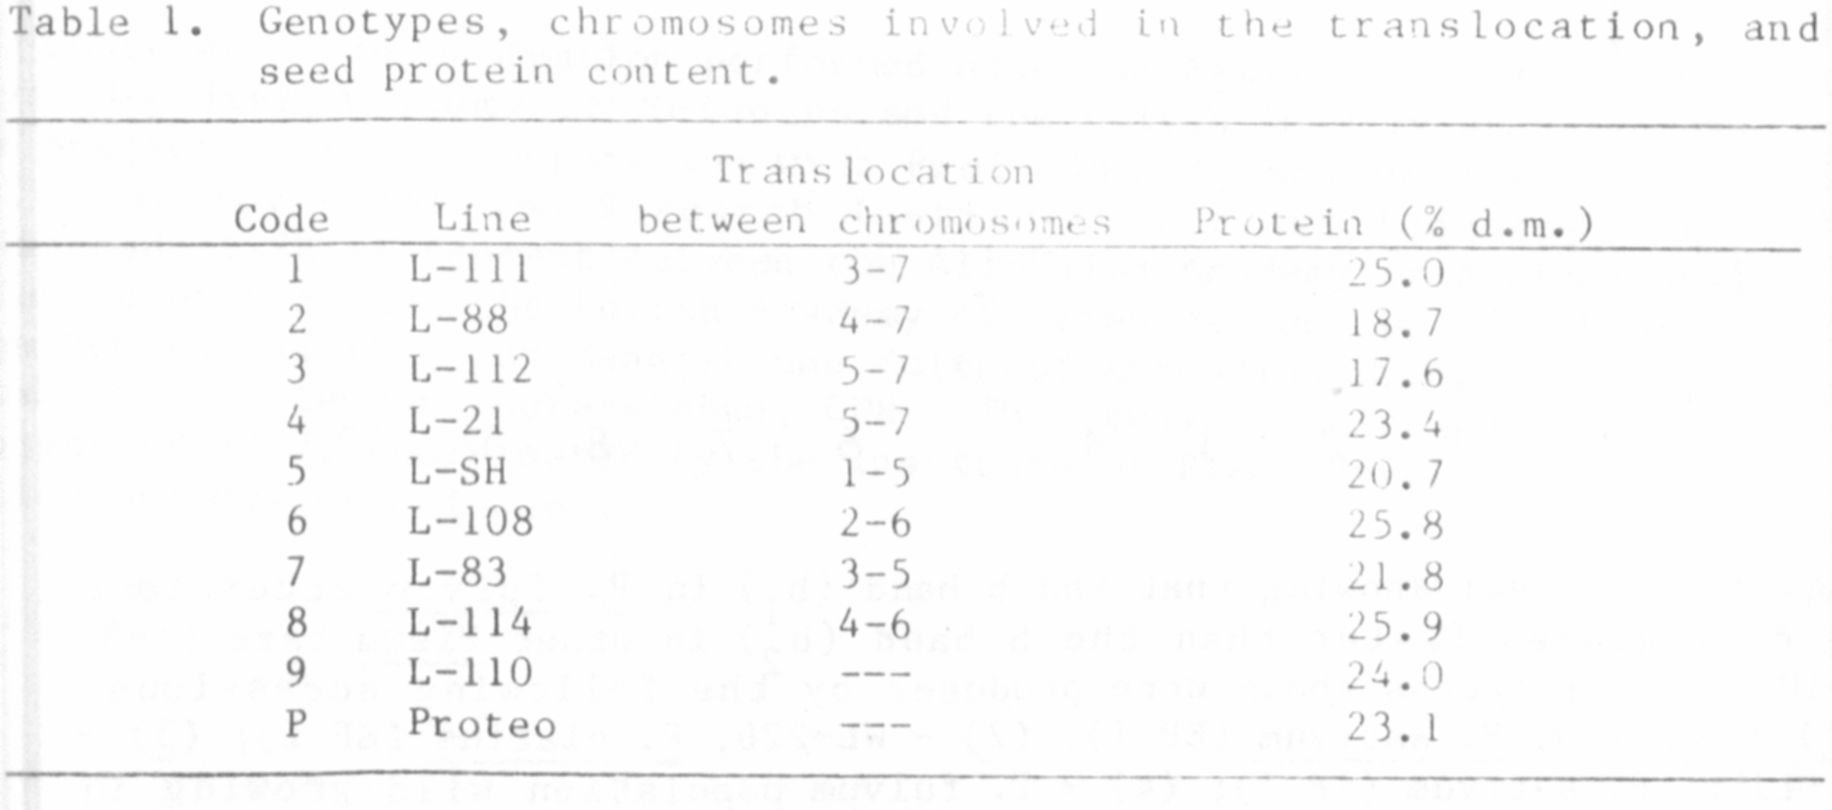
The seed storage proteins (globulins) of 8 reciprocal translocation
lines (Table 1) obtained from Dr. Lamm (Sweden) and of the F1's between
these and two test lines were extracted from one cotyledon. The second
cotyledon, along with the embryo, was used to propagate the Individual
into the next generation.
The cotyledon was finely ground and the powder extracted twice at
4°C in borate buffer pH 8.5 with 0.5M NaCl. Globulins were prepared and
submitted to SUS-electrophoresIs as described elsewhere (2).
Large differences in seed protein content were observed (Table 1).
Electrophoretic patterns of the globulins revealed both quantitative and
qualitative differences among the mutants and between the mutants and
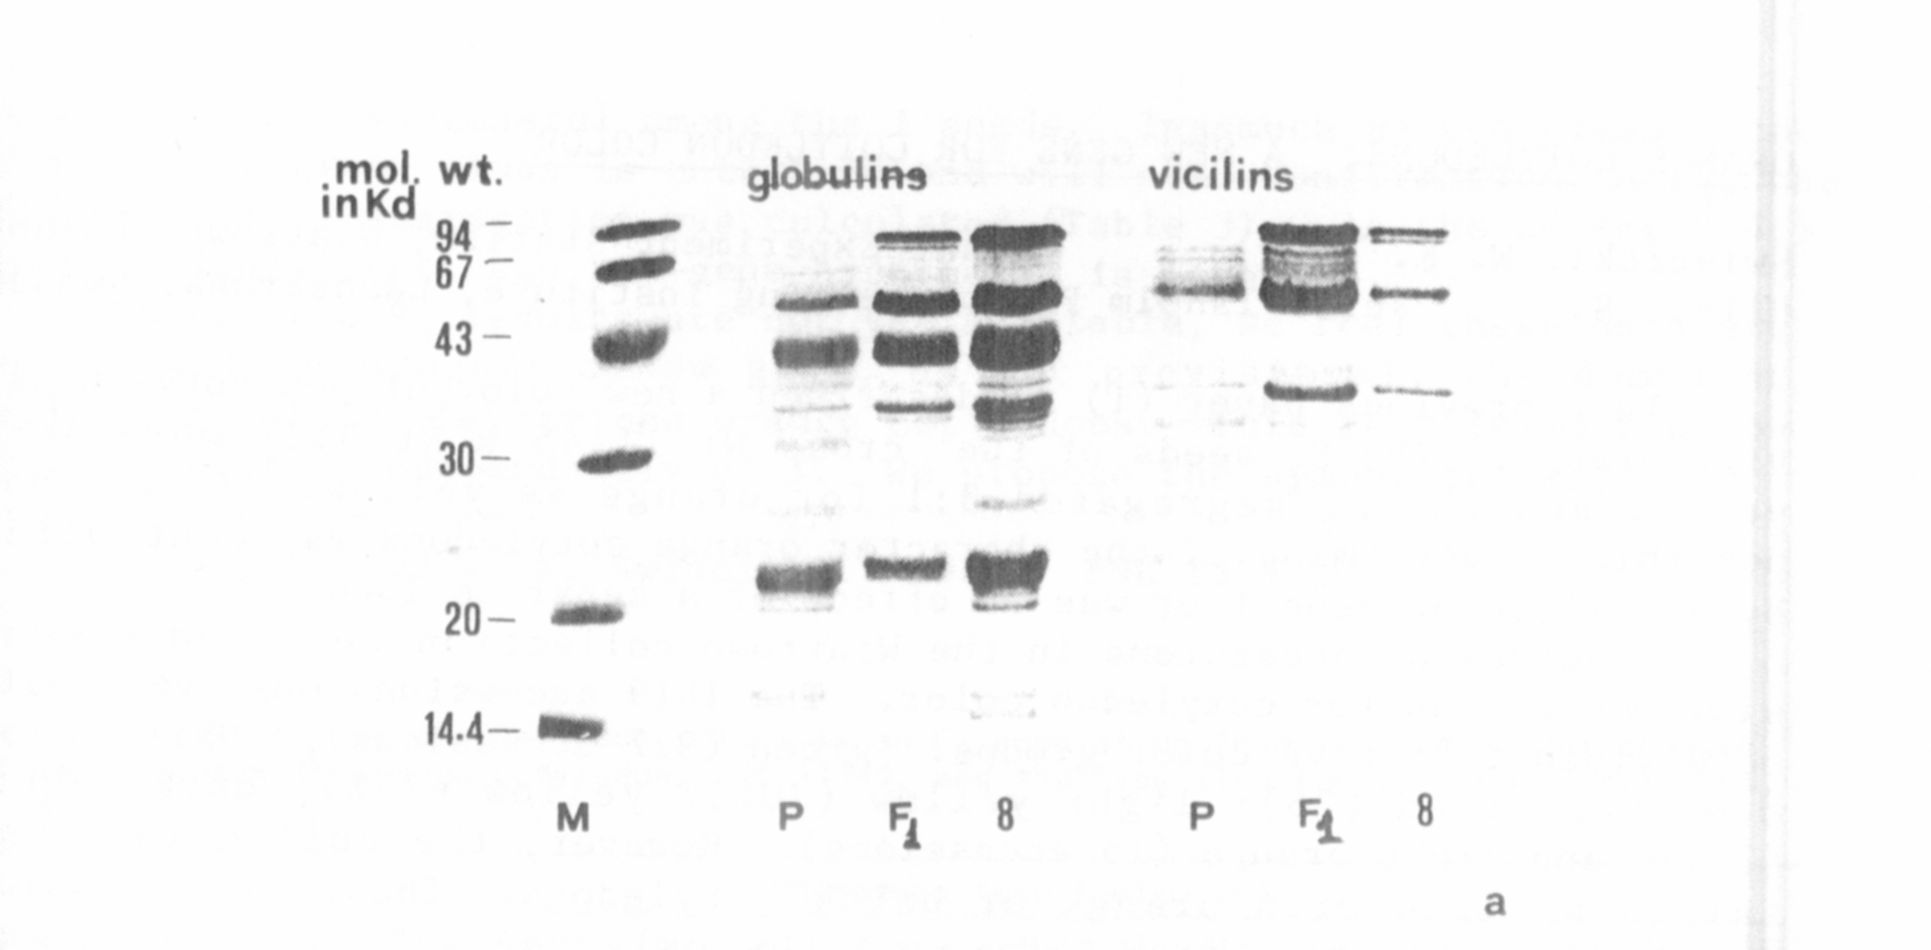
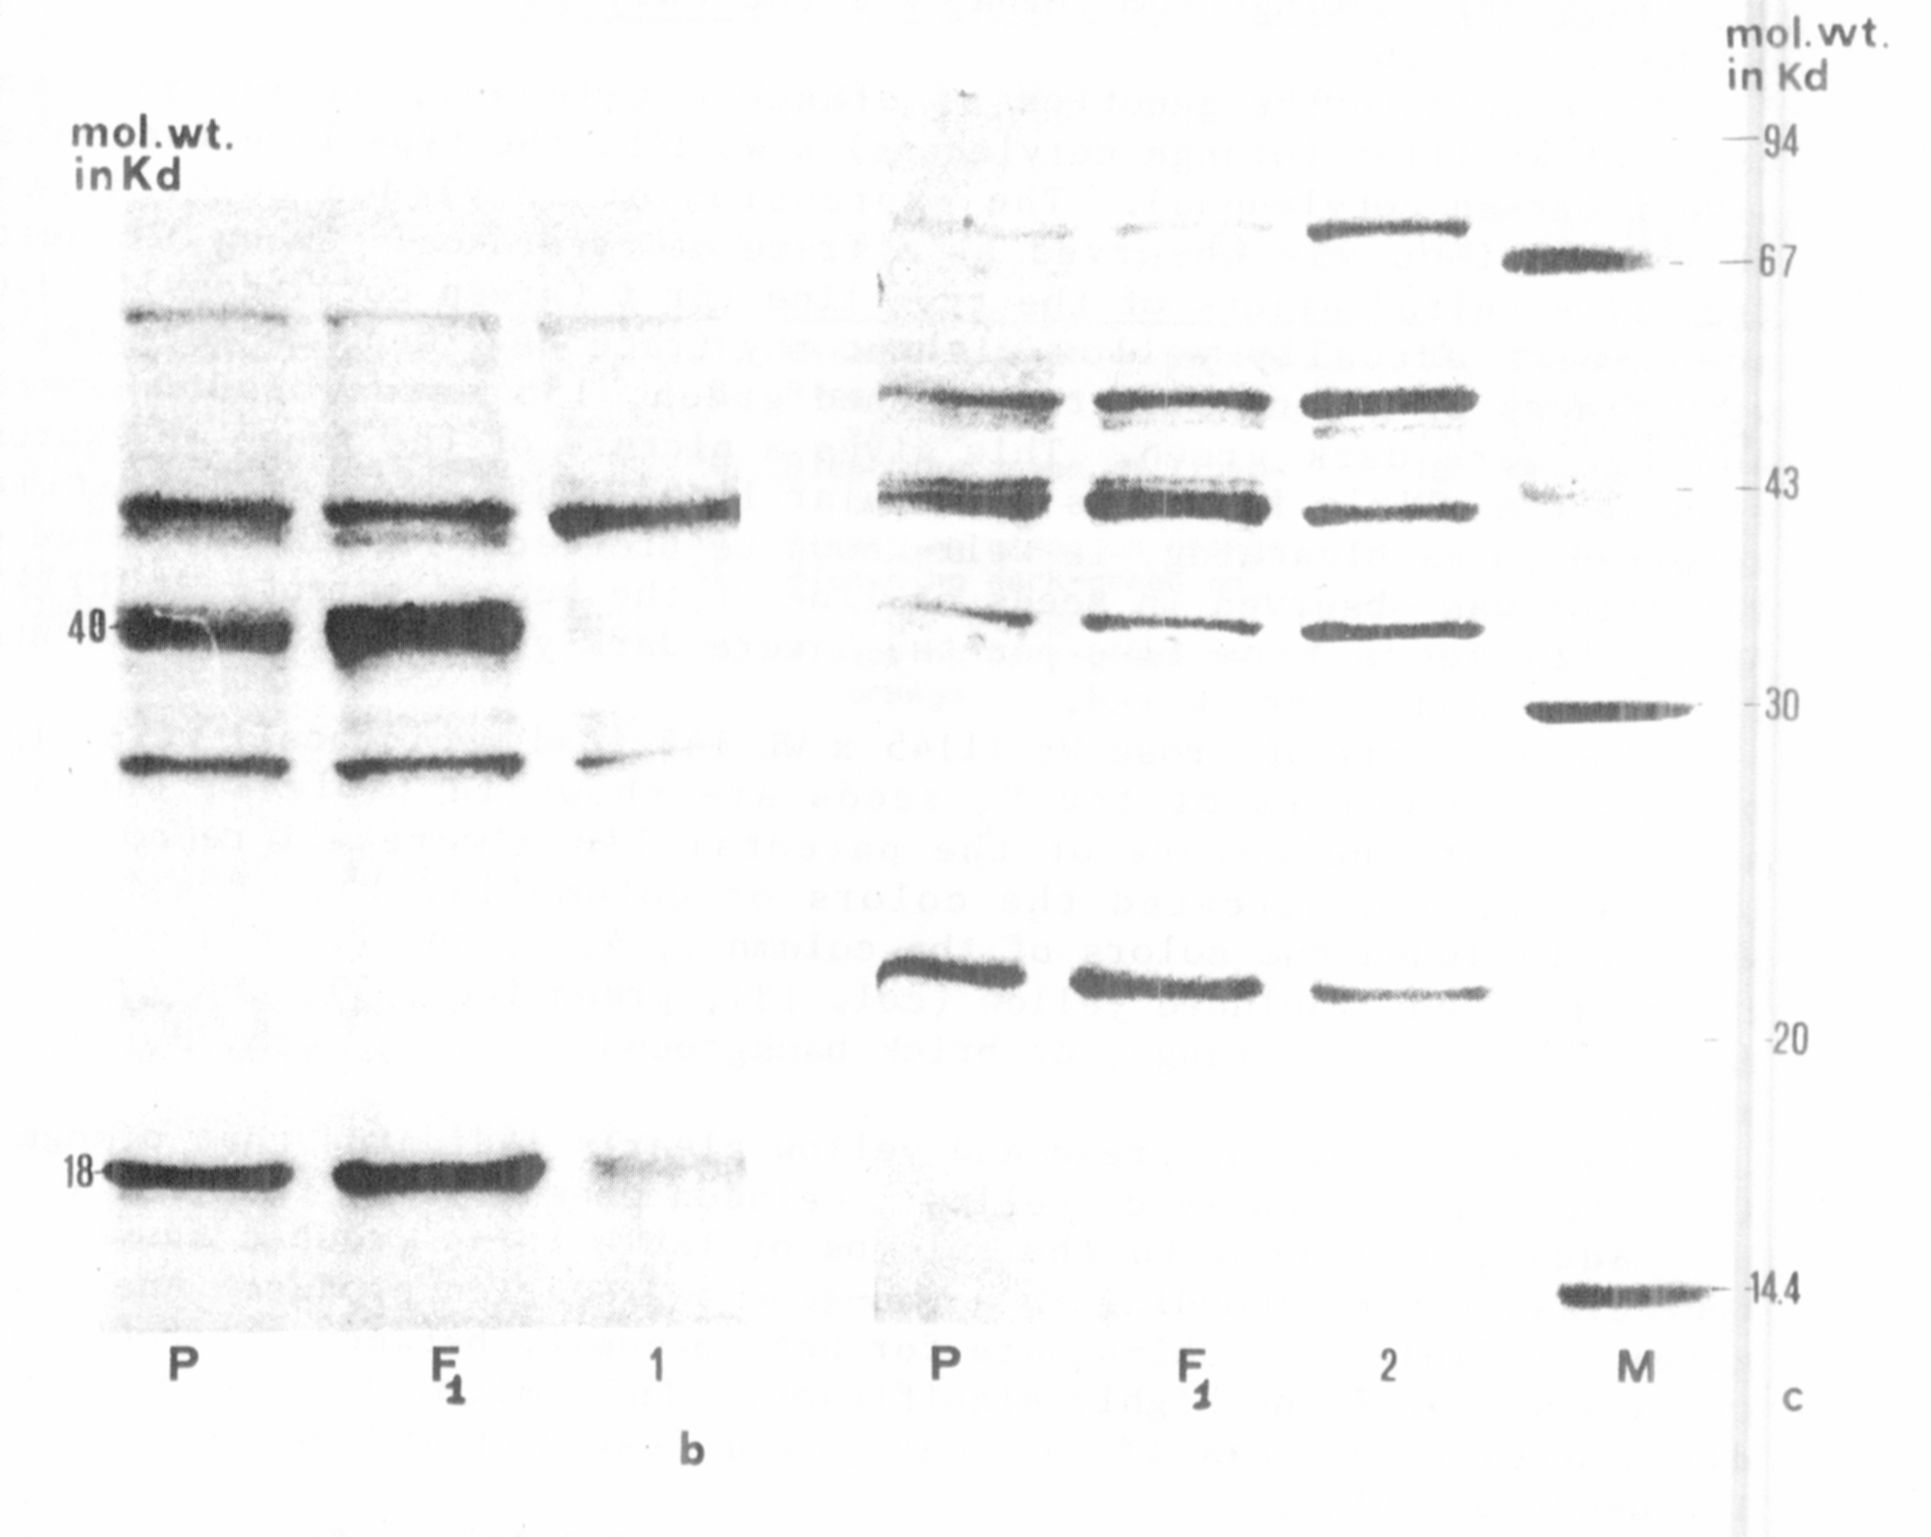
the test lines. The patterns of three mutant lines are shown in Fig. I.
The relative amount of convicilin (71 - 74 Kd zone) was considerably
different among the samples (Fig. 1c) while differences of subunit
structure were particularly evident in the zone ranging 40 Kd (Fig. lb)
and 1 kd (Fig. 1 a). The F1 cotyledons (Fig. 1), obtained from parents
having different electrophoretic patterns, showed intermediate profiles
with respect to the number of subunits and their relative amounts,
indicating a codominant relationship between the alleles coding for
these subunits.
Because of differences in background genotype, the relationship,
if any, between the observed electrophoretic variations and the
chromosome aberrations of the mutants could not be established. This
will be attempted by analyzing the F2 generation.
I. Gottschalk, W. and A. P. Muller. 1 982 . Qua 1 . Plant. Plant Foods
Hum. Nutr. 31(3):297-306.
2. Rao, R. and J. C. Pernollet. 1981. Agronomic. 1:909-916.